Where are electricity demand reductions coming from? Not from where we hoped
Electricity demand has fallen substantially in the last couple of years and shows no sign of recovery. The cause could be:
- The impact of economic slowdown
- Better energy efficiency
- Demand reduction because of the high prices seen in recent years.
If the cause is the contraction in the economy, then we can expect electricity use to rise again when growth resumes. On other hand if it is energy efficiency, then it is reasonable to expect that the reduction will persist. Electricity demand is usually thought to be insensitive to the price of power. If it is high prices that are driving usage reductions, we have gained important information about how to reduce electricity use, and thus carbon emissions.
The conclusion of the analysis in this short note is that almost all of the reduction in energy demand comes from cuts in usage in big industrial and commercial users. This means that the most likely cause of the cut is the fall in economic activity. Household demand seems to have remained about constant.
***
The data National Grid publishes demand data for every half-hour period. The latest publicly available information covers January – March 2009. Manipulation of this data is made difficult by the varying dates of public holidays and weekends across different years, but broad analysis is possible.
Demand reductions between 2008 and 2009 are given in this table:
| Month | Reduction between 2008 and 2009 |
|---|---|
| January 2009 | -1.5% |
| February 2009 | -1.5% |
| March 2009 | -6.9% |
| Total for the period | -3.2% |
This table might seem to suggest an accelerating decline. This would not necessarily be the right conclusion. Electricity demand is affected by temperature, which was unusually low in January and February and high in March.
The following table compares England temperatures in 2009 and 2008:
| Month | Mean England 2009 temperature (degrees C) | Mean England 2008 temperature (degrees C) |
|---|---|---|
| January | 2.8 | 6.3 |
| February | 3.9 | 5.2 |
| March | 6.7 | 5.9 |
So the underlying reduction in January and February 2009 may be understated, while the precipitous fall in electricity use in March 2009 is partly an artefact of the relatively high temperatures in the month.
Can we say anything about what is driving these reductions? National Grid demand data is provided for each half-hour period. So we can compare the pattern of reduction for each part of the day.
I looked at March in detail. I excised the data for Easter in 2008 (when it fell in March as opposed to April in 2009) and the comparable days in 2009. I ensured that the 2008 and the 2009 data contained the same number of weekdays and weekend days. This allowed me to make a reasonably fair comparison between the two months.
I then calculated the average reduction in use at each half-hour point in the day. So, for example, I obtained a figure for the average electricity use at 4.30am for March days in 2008 and 2009.
Here is the pattern of reduction across the 48 half-hour periods in a day:
March 2009 UK electricity demand as percentage of March 2008, by time of day
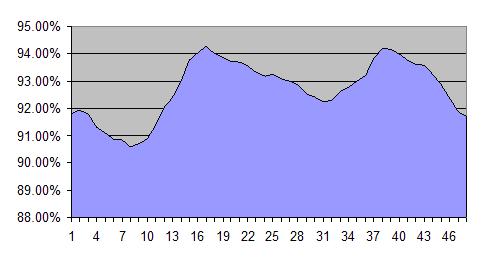 This chart shows that electricity use reduction varies from almost 10% (at around 4am) to less than 6% in the morning and early evening.
Someone from the electricity industry looking at the chart above will immediately notice something. The periods of least reduction from 2008 to 2009 are also the periods of highest electricity demand from domestic homes. The chart below is scraped from the Environmental Change Institute’s study ‘The 40% House’. It shows the pattern of daily winter demand for UK electricity in 2002 and splits it into domestic and non-domestic. Demand peaks at about 7.30am and 6pm. These are the periods of least reduction in electricity demand between March 2008 and March 2009:
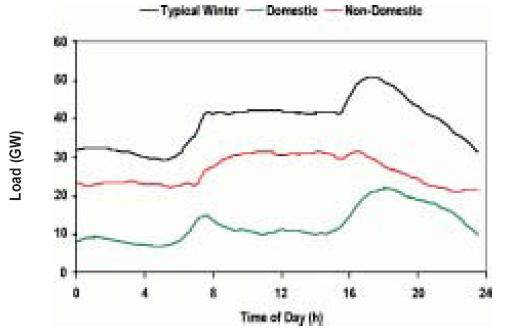
Source: Environmental Change Institute.
What does this mean? We can’t be completely sure, but the most likely explanation is that UK domestic demand is virtually unchanged while industrial demand has fallen very sharply.
Home use of electricity is about one third of total UK use. Industry is another third, while offices, shops and other commercial installations take the final portion. But as you can see from ECI chart above, the domestic proportion is far higher in the morning (toasters and last minute ironing) and early in the evening (TVs, supper, and the washing machine). So if domestic demand is largely unchanged, we’d expect to see far lower reductions in aggregate electricity demand at these points in the day. And that is exactly what we do see.
Conversely, at 4am when domestic demand is only about 20% of the total, but the big industrial electricity users are still using power for making steel, plastics, bread or whatever, aggregate demand is down almost 10%. This cut almost certainly arises from lowered levels of economic activity, and it might be augmented by the energy use reduction plans implemented by many large industrial users.
All in all, my best guess is that the March data is consistent with about a 10-12% reduction in electricity use in industry, perhaps 6-8% in offices and shops, and a very small cut in consumption in homes.
Why is this disappointing? We might have hoped that the squeeze on personal incomes, high electricity prices, and improved energy efficiency in appliances would by now be making a measurable impact on electricity use in the home. But there’s no evidence of this from the data. Second, we might also have been optimistic that energy reduction programmes in some industries would have reduced use. But, if anything, the reverse is true. Latest UK data (Index of Production for Q1 2009, published 12 May) suggests that industrial output was down 12.1% compared to 2008, slightly more than my estimate of the fall in electricity use. The bad news is that my very rough analysis of the data shows that we can explain all the fall in electricity consumption as a result of the economic recession and none as improved energy efficiency or a reduction in waste. When growth resumes, we’ll probably see electricity use accelerating at a rapid rate. The implications for carbon emissions are, of course, severe.