Look carefully and you can see solar PV output denting UK electricity demand
When the sun is shining, solar PV on roofs cuts apparent electricity demand and reduces the call on conventional generating stations. Can we see the effect in the national figures for power need? Yes, it seems we can. The last few days have been sunny so I compared electricity demand this year with a comparable period in June last year when it was very dull indeed. Overall, power use is down slightly but apparent demand in the sunniest bit of the day is strikingly below the average for last year. The 2.5 gigawatts or so of PV on roofs and in fields appears to be having an observable effect on the need for daytime electricity production. I compared the seven days from 31st May to June 6th with the period of 20th June to 26th June 2012. You’d expect electricity demand to be roughly comparable in these two periods. Average generation in 2012 was about 32.8 gigawatts and about 3% lower in 2013. But the daily pattern of generation varies substantially between the two different weeks. Nighttime demand was slightly higher in 2013 while daytime requirements on the grid were almost 2 gigawatts lower.
Chart 1
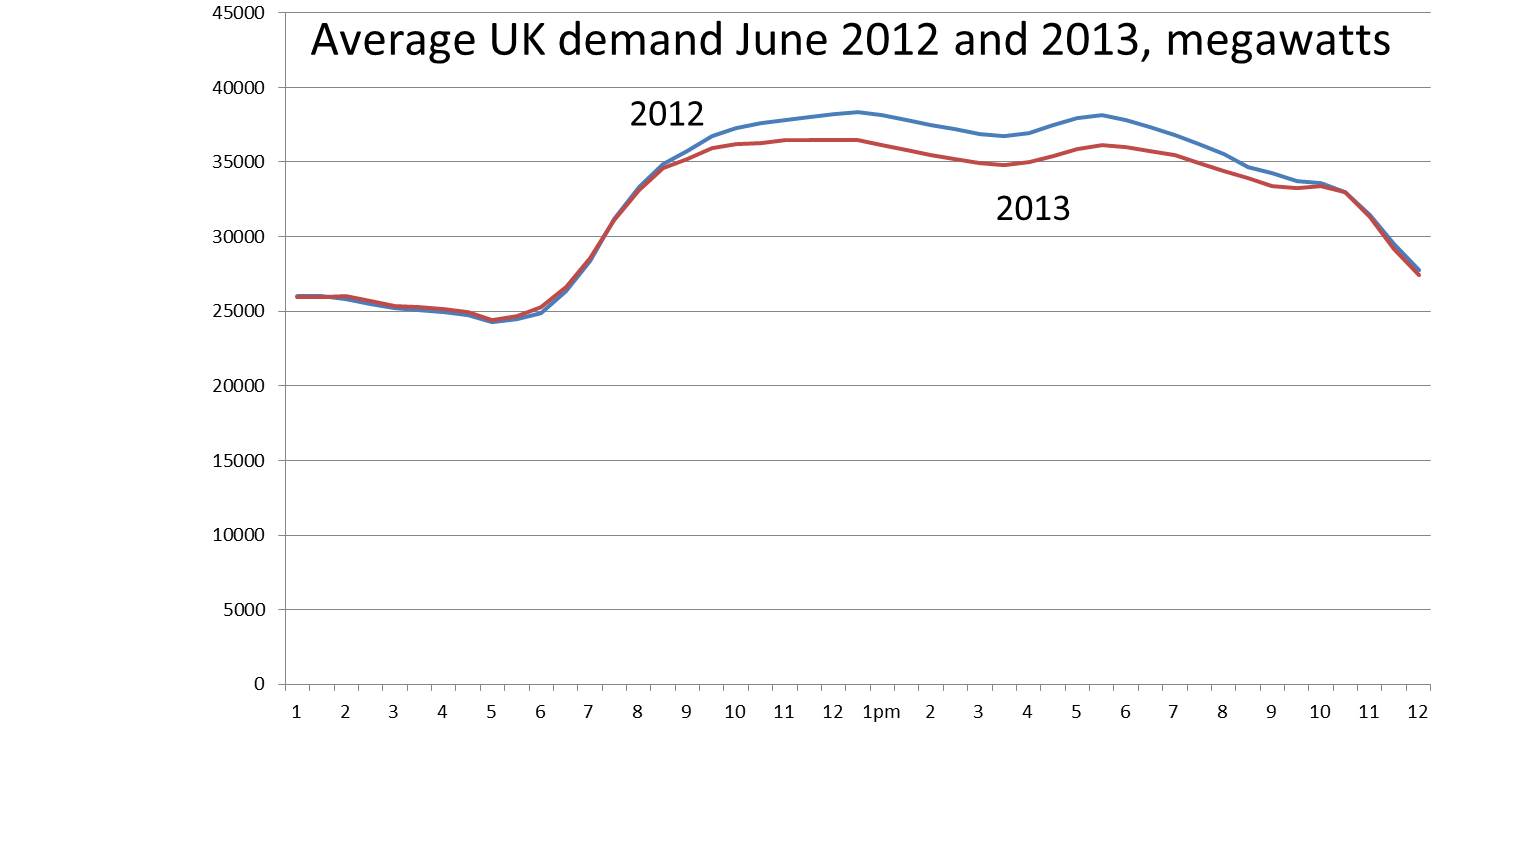
Source: Elexon
The chart below expresses this simply as the difference between the two years. A negative figures means demand in 2013 was lower than in 2012.
Chart 2
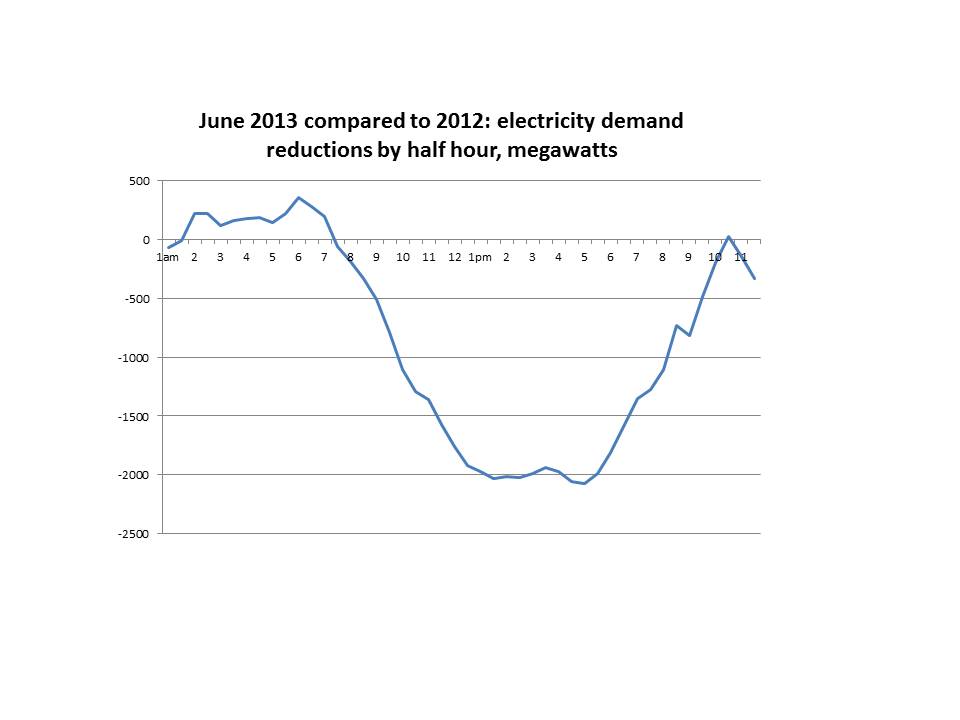
Source: Elexon.
It’s plausible that the prime cause of this daytime demand drop is the three hundred thousand or so domestic and factory roofs providing most or all of the electricity to the building. The daily period over which the demand reduction is seen is slightly later than I would have guessed. Lower demand starts at around 8 am but continues until 9 or 9.30 pm, when the sun is almost set.
Forecast German solar production today (7th June) has a slightly different pattern. (‘Solar time’ in central Germany is about 30 minutes in front of us: the clocks are an hour in front but the sun rises somewhat earlier because Germany is east of the UK). It has died down by around 8 pm. These figures are the reverse of the UK in that they express PV as a positive addition to electricity output rather than as a reduction in demand. Nevertheless the broad picture is the same as in chart 2.
Chart 3
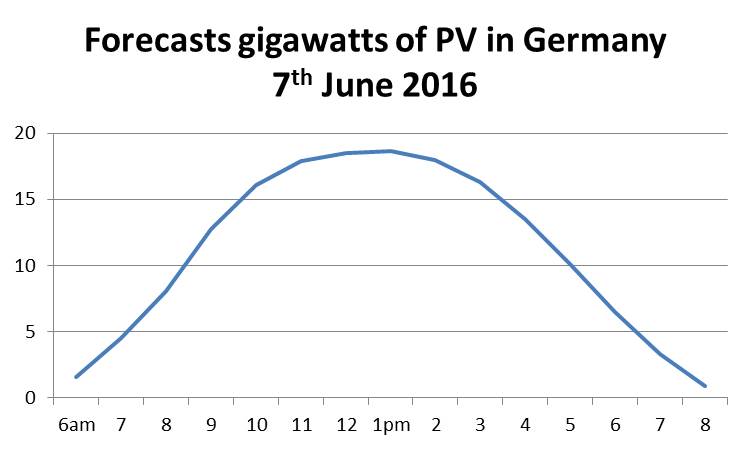
Source: EEX Transparency Platform
I’d hesitate before saying that we can definitely see the impact of PV on UK demand but it’s a reasonable hypothesis that summer daytime electricity production on sunny days is being depressed by up to 2 GW – 5-6% of total demand.