'Peak Stuff': households now spend more on services than physical goods
IKEA’s Steve Howard announced the arrival of ‘peak home furnishings’. He seemed to be saying that households were tending to consume fewer of the products his company sells.
In 2011, I think I wrote the first article on the plateau in the UK’s consumption of material goods. It was entitled “Peak Stuff’ and is available on this website. I looked at a variety of indicators of falling demand for physical objects, ranging from water to cement or fertiliser. I also suggested that other phenomena, such as the decline in the use of energy and the fall in the number of miles travelled, were also occurring in other developed economies.
Steve Howard’s much quoted comments prompted me to go back to look at the data on materials use. The most obvious fall in growth has occurred in the production of steel and concrete. The sharp slowing in Chinese GDP growth has flattened the output of both of these industries. The country is responsible for about 50% of world use of both commodities. So for the first time in living memory global steel and cement use is down. Aluminium, the next most important metal, is more robust, but only slightly.
Controversial in 2011, it’s now accepted that energy use is also falling across most of the OECD countries and Britain’s requirements continue to fall 1-2% a year, even as the economy continues to perform relatively well. Our aggregate use of materials is continuing to fall, as is also the case in the EU as a whole.
I looked quickly at one other aspect of ‘Peak Stuff’. Using government data, I’ve tried to assess whether British households are indeed spending less on buying physical objects. Is Steve Howard’s downbeat assessment of IKEA’s prospects in the UK justified by recent patterns of domestic purchases?
The answer is ‘yes’. British consumers devoted 26 % of their total household purchasing to physical goods in the early part of the last decade. This fell to about 21 % by 2014, the last year for which good data is available. Spending on all major categories of items fell as a percentage of income. That includes furnishings, clothing, cars and consumer electronics. The fall wasn’t regular but the direction of change is clear.
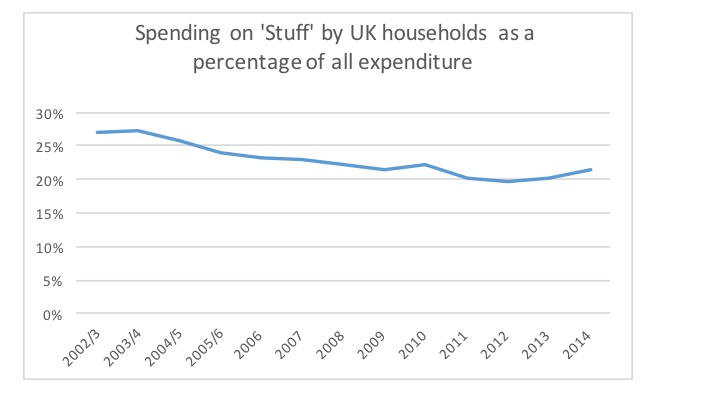
Source: ONS Family Spending
The uptick in 2014 was driven by increased spending on buying cars. However all sectors of expenditure on physical goods saw a decrease between 2002/3 and 2014.

Source: ONS Family Spending
You would be entitled to respond by saying that rising fuel costs, increasing rents and larger mortgages had drained householders of their purchasing power. Every type of discretionary expenditure might therefore be down over the last decade or so. That actually isn’t the case. Spending on services, such sports admissions or satellite subscriptions, rose from 21% of all household expenditure in 2002/3 to 22% in 2014. It is a small percentage rise but in the last few years we’ve seen the money going to services growing to be larger than the cash spent on all forms of goods. Holidays have been particularly buoyant. (These figures exclude rent, utilities and mortgage interest payments).
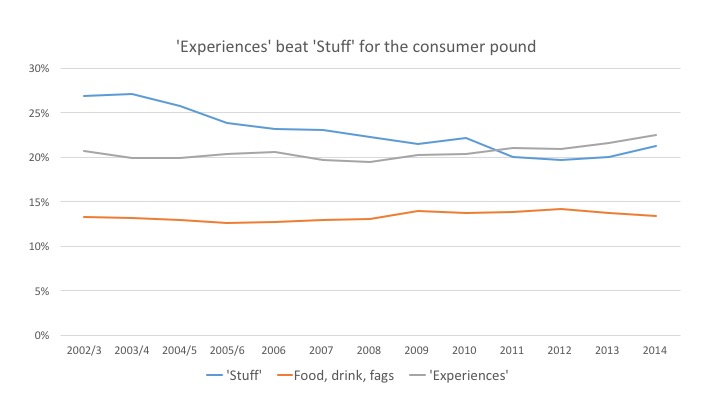
Source: ONS Family Spending
Services beating physical goods for the household pound is a new phenomenon, here or elsewhere. Steve Howard is right to be anxious. IKEA better start selling us pleasurable and enticing leisure services rather than trying to flog us more strangely named articles of bedroom furniture. We already have enough.
More generally, those who worry about a secular stagnation in the West probably need to look closely at whether Peak Stuff is going to depress economic growth over the next decades.
A quick note on method.
ONS publishes a fascinating yearly survey called Family Spending (and has done for many decades). It records the actual expenditure from thousands of UK households, ranging from funeral plans to bananas. Spending is split into hundreds of categories. I’ve decided whether each category is predominantly a physical good or a service. I excluded food from the ‘goods’ section but kept in clothing, furnishing, books and newspapers and many other lines. I did the same for services. You could quibble with some of these allocations but I think the general conclusion is robust. There is a swing away from things made of metal, textiles and plastic towards spending on experiences. You can have a copy of my spreadsheet if you would find it useful, but it is a bit messy.