The journalist Andrew Neil published an article on 27th August about offshore wind in the Daily Mail, a UK newspaper. The article contains a large number of factual inaccuracies. I have commented on these in 15 notes in the text below. These points are are embedded below and to the right of the relevant sentences in the Andrew Neil text (which is now all in a bold font).
Many of Mr Neil’s other assertions in the article are highly contentious but I have tried to restrict my responses to clearing up the most obvious errors in his text. Where useful, my comments are accompanied by a reference that provides the source for my corrections
Andrew Neil, Daily Mail 27th August
For those deluded enough to believe government claims that renewable energy is the key to a glorious future of clean, cheap energy, have a look at the plight of Orsted, the world's biggest wind farm developer.
Until recently, it was Denmark's industrial champion and the darling of the Green Blob, with investments across the globe including 12 offshore wind farms in British waters.
Yet today Orsted is a financial basket case, surviving thanks only to the prospect of a multi-billion-pound bailout from the Danish taxpayer.
Note 1
Ørsted is not a ‘financial basket case’. Here is a quote from the Economist of 28th August 2025[1]:
‘Orsted’s financial position is not yet a cause for alarm. Its annualised return on capital employed was a relatively healthy 7.5% in the first half of 2025, rising to 12.3% once accounting impairments and costs related to project cancellations are excluded. Analysts expect it to generate an operating profit (before depreciation and amortisation) of DKr 28bn this year, about as much as in 2024 and enough to comfortably service the company’s DKr 66bn pile of net debt.’
Its fall from grace is a case study in the pitfalls of renewables, especially wind power. And it has huge implications for UK Energy Secretary Ed Miliband's zealous obsession with 'decarbonising' our electricity grid by 2030 so that it is overwhelmingly powered by renewables alone.
Even before Orsted ran into trouble, that was always going to be a stretch. Now, with the Danish giant wallowing in the knacker's yard, it is (spoiler alert) mission impossible.
Note 2
Ørsted is not ‘wallowing in the knacker’s yard’. Here is a second quotation from the Economist of 28thAugust 2025[2]:
‘Yet despite the stormy weather, there is no need for Orsted’s investors to panic.’
In May, citing escalating costs, Ørsted announced it was handing back the contract Miliband had just given it to develop Hornsea 4 off the coast of Yorkshire, earmarked to be Britain's biggest offshore wind farm.
Note 3
Ørsted did not ‘hand back the contract’. In a press release on 7th May the CEO of the company said[3]:
“I’d like to emphasise that Ørsted continues to firmly believe in the long-term fundamentals of and value perspectives for offshore wind in the UK. We’ll keep the project rights for the Hornsea 4 project in our development portfolio, and we’ll seek to develop the project later in a way that is more value-creating for us and our shareholders.”
This despite the fact the contract came with massive subsidies and generous price guarantees.
Note 4
Mr Neil fails to understand the way the UK system for financing renewables work. There are no ‘massive subsidies’. Instead, renewables developers such as Orsted bid for a single guaranteed price for their electricity output for a period of years. This scheme is called ‘Contracts for Difference’ or CfD. Orsted has been a bidder in many of the UK government’s auction for CfDs. There is no separate subsidy scheme.
Orsted added that it had no plans to bid for any more UK wind farm developments.
Note 5
No, it did not add this point. In the 7th May press release mentioned above the CEO said[4]:
“We remain fully committed to being an important partner to the UK government to help them achieve their ambitious target for offshore wind build-out and appreciate the work they’ve done to deliver a clear framework to support offshore wind..”
Cue silence from Miliband and his increasingly discredited Department of Energy Security and Net Zero.
Note 6
Mr Miliband was abroad when the announcement was made. Reuters reported that he commented as follows[5]:
Britain's Energy Secretary Ed Miliband hoped the plans could be revived.
"We are still committed to working with Orsted to seek to make Hornsea 4 happen by 2030," Miliband told reporters while on a visit to Norway.”
This assertion supports the point made above that Orsted did not ‘hand back the contract’.
Orsted's troubles started in America, where it was investing big. In 2023 and 2024, it had to halt two massive projects because higher than expected costs and supply chain problems were making them uneconomic, despite subsidies from the then Biden administration, which shared Miliband's enthusiasm for renewables.
American withdrawal cost Orsted $5.6billion in 'impairments' – accountancy jargon for huge losses – and marked the start of serious financial trouble. Its share price tanked and Orsted was forced to announce a $9.4billion 'rights issue' to raise fresh capital.
Note 7
Orsted has not withdrawn from America. On 16th December 2024 it announced a new US CEO, Amanda Dasch, in a press release which included the following sentences[6]:
"We're thrilled to welcome Amanda to our leadership team and to draw from her 20+ years of energy experience in the U.S. to guide and advance our plans to build an American energy industry across technologies, including offshore and onshore wind, solar, and battery storage," said Rasmus Errboe, Deputy Chief Executive Officer and Chief Commercial Officer, Ørsted. "Amanda joins a strong Region Americas team that is advancing a core market for our company, and I look forward to her joining us in January.”
Since the Danish government is the biggest shareholder, the Danish taxpayer is on the hook for at least half of that (unless the Danes are prepared to let their former champion go to the wall, which is unlikely).
The cost of the state bail-out could be even higher now that Donald Trump, no fan of wind power, has ordered a halt to Orsted's $1.5billion wind farm development off Rhode Island pending investigation into the national security implications of foreign-owned critical infrastructure (something that, in its mad dash to Net Zero, seems to cause our own government no concern).
Of course, Miliband claims developing our own renewables will ensure security of supply – by reducing our dependence on supposedly unreliable foreign gas. But most of our gas comes from Norway these days, which is a pretty secure supply.
In contrast, wind turbines and solar panels are nearly all imported – increasingly from China – which might not always be reliable.
Note 8
With respect to wind turbines, this is not true. The large majority of wind turbines in the UK, onshore and offshore, are made by European manufacturers[7]. Some are also made by the US company GE Vernova. The UK is a particular centre for the manufacture of offshore wind turbine blades in Siemens Gamesa’s Hull factory.
If Miliband really cared about security of supply, he wouldn't be shutting down any further oil and gas exploitation in the North Sea. But he is. Norway, on the other hand, has just discovered a massive new oilfield it plans to develop.
Orsted's troubles are proof positive that cheap renewable energy is a lie.
After all, if wind power was going to sweep all before it by outcompeting nasty fossil fuels and nuclear power, why do developers like Orsted demand ever bigger subsidies to continue investing?
Wind power is only cheap if you ignore most of the costs associated with it, a sleight of hand Miliband and his ilk have been allowed to get away with for too long by an unquestioning media which has largely swallowed the Net Zero agenda.
When you include the cost of offshore wind power – the building and sinking the turbines in the sea, the cables required to take the power onshore, the transformers required to insert the power into the National Grid, the upgrading of the Grid to deal with the 'intermittency' of wind power and the cost of keeping gas-fuelled electricity generating stations ticking over for when the wind isn't blowing (or blowing so much the turbines have to be closed down) – then wind power is anything but cheap.
Note 9
1, The costs mentioned by Mr Neil, such as putting foundations in place are paid for by the wind farm developer and the cost is covered in the CfD price. 2, There will be no need to upgrade the electricity distribution system (‘the Grid’) to cope with the intermittency of wind power. There will be investment in large scale batteries and other forms of electricity storage but intermittency itself does not mean the Grid will need to changed. 3, Gas-fuelled power stations are not kept ‘ticking over’ for when the wind isn’t blowing. Yes, at the moment the Grid always keeps about 2 gigawatts of gas power operational even when wind speeds are high. This is to provide what is known as ‘inertia’ to the network and, second, to help deal with unexpected short-term variations in the supply from other sources. But gas-fired power stations are not kept operational in order the deal with future periods of low wind speed.
Consider the following figures. Gas recently cost about £60 per megawatt hour (MWh). To that, the Government adds a carbon emissions levy of £15/MWh, taking the cost of gas for electricity generation to £75/MWh.
Note 10
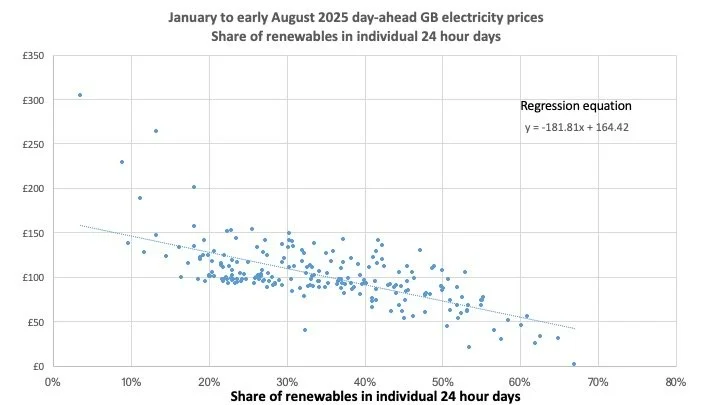
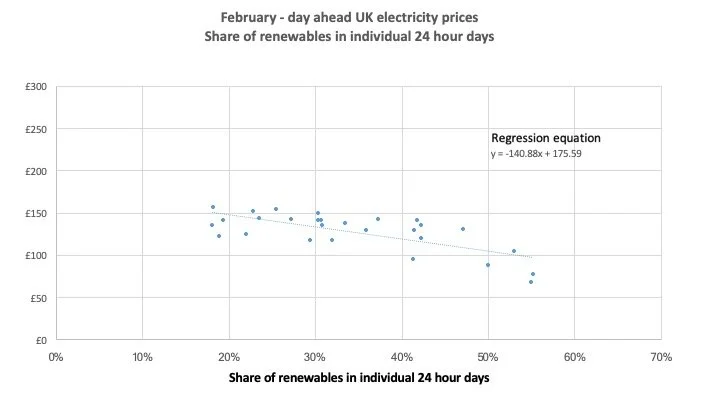
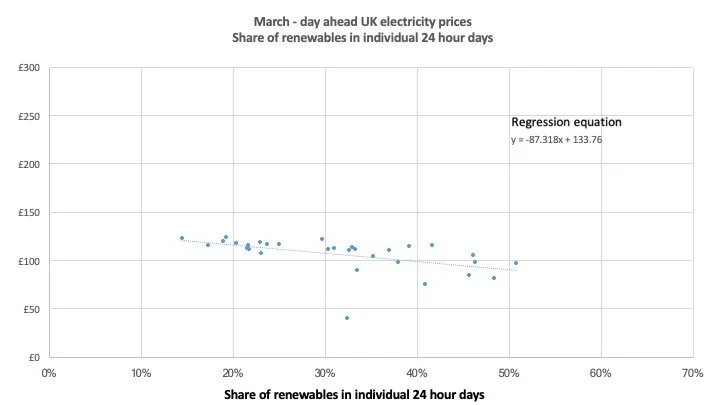
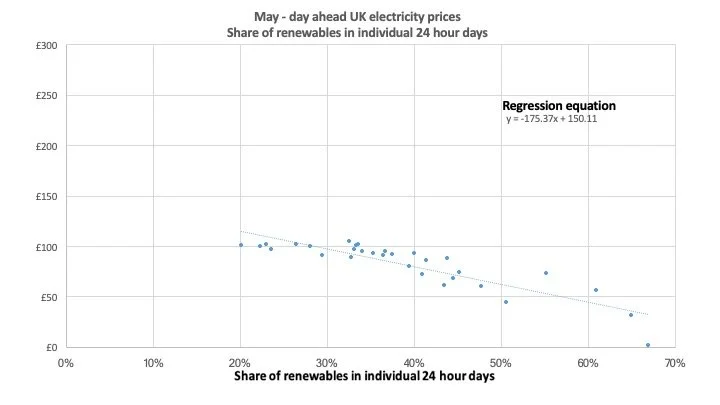
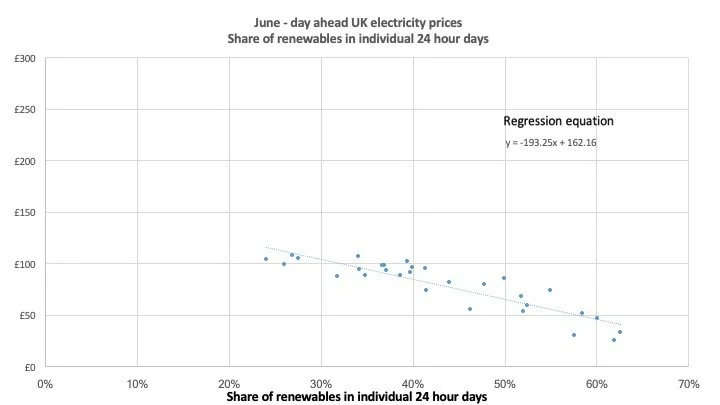
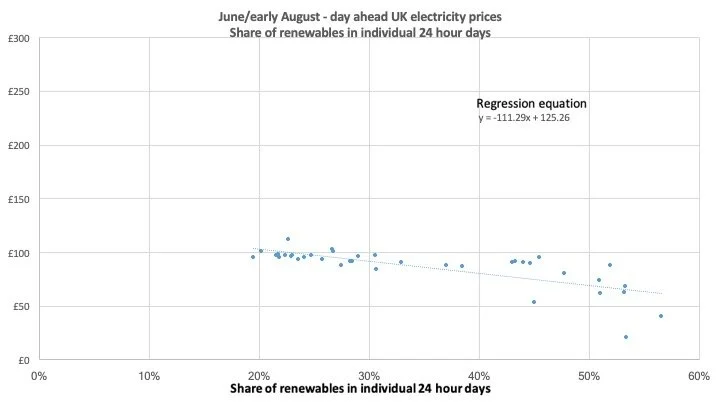
In the UK market as currently configured, the cost of electricity is almost always set by the lowest price offered by gas-fired power stations competing in the power markets. The average ‘day ahead’ hourly electricity price in the UK in these markets over the first 220 days of 2025 was about £100, not £75, and this is what electricity produced from gas will have been worth to power station owners[8]. Recent days have seen temporarily lower prices because demand has been restrained during the summer holidays but the price is highly likely to revert to the standard levels in September.
The carbon emissions levy is approximately £25 per megawatt hour, not £15. (This is included in the £100 figure, as is always the case in industry analyses).
Offshore wind automatically gets the £75/MWh plus another £83/MWh in subsidies to pay for the costs outlined above – plus another £32/MWh to pay for various technical matters related to the stability of the National Grid.
Note 11
This is the most serious problem in the article. This comment suggests Mr Neil has no understanding of the way the UK is incentivising wind and solar developments. Large scale renewables, such as offshore wind, now typically bid into Dutch auctions for Contracts for Difference. If they win, the government ensures they are paid a guaranteed price for each megawatt hour they produce. (Please see Note 4 above). They do not receive the market price for electricity in addition to this. Nor do they receive ‘another £32/MWh to pay for various technical matters..’ or any other subsidy. The last auction for offshore wind CfDs produced a quaranteed price of £58.87 (in 2012 prices) per megawatt hour[9]. Inflated to July 2025 prices, this auction price is just over £85. This means the numbers in the next sentence are wholly wrong.
That's a grand total of £190/MWh for wind versus £75/MWh for gas.
Note 12
The correct way to compare gas-fired electricity and offshore wind to use the £100 figure for gas (Note 10) against the current CfD price for offshore wind (which may rise or fall at the next auction) of around £85 per megawatt hour. In addition, offshore wind should be assumed to add some costs to the running of the Grid. Large batteries, for example, are needed to help ensure that short-term surpluses and deficits of electricity can be accommodated. New grid connections have to be constructed. Estimates vary as to the real cost of adding more large-scale wind or solar to the power supply but figures of between £10 and £25 per megawatt hour are estimated. The most recent government estimates (from 2023, and therefore now out-of-date) suggest direct offshore wind costs are less than half those of a modern gas-fired power station.[10]
More in subsidies for wind than the total cost of gas.
Note 13.
This is wholly incorrect, as the above numbers show. There are no direct subsidies to today’s offshore wind farms. They are paid a guaranteed price which will sometimes be higher than the market price for electricity and sometimes lower.
And remember, you are picking up the tab for all this in higher energy bills, taxes and the soaring price of anything (including food) that uses energy.
No wonder British households now face some of the highest energy bills in the world and our heavy industry has been decimated by huge energy costs (the highest in the developed world) – £228/MWh in the UK versus £110 in Germany, £65 in France and £52 in Sweden.
Note 14
This sentence contains another very serious error. UK heavy industry’s electricity costs are subsidised by the UK and are expected to be around £86 per megawatt hour after a small adjustment which has just been introduced[11]. According to Ed Miliband’s department, this figure compares with £69 in France and £60 in Germany. Secondly, it is certainly true that UK domestic electricity bills are high compared to most other countries. The excess arises largely, as stated above, because the wholesale price of electricity is set in the UK by gas-fired power stations and not because of payments to renewable generators.
And all to further Miliband's vainglorious pursuit of Net Zero, on which billions are being squandered while households and industry are impoverished. Of course, as always, a privileged few are doing well out of the madness. Failed, has-been politicians feather their retirement nests by sitting on Green Blob lobbies and quangos. Landowners replenish their depleted family fortunes by accommodating wind turbines on their estates. Green zealots, such as Dale Vince, become multi-millionaires supping at the generous teat of subsidised renewable energy while bankrolling the Labour Party.
The misuse of our money staggers even me – and I've been following energy policy for years. Miliband has pledged £50billion in subsidies to develop carbon capture and storage (CCS), a dubious and untried technology designed to bury CO2 emissions underground.
A study of eight CCS projects around the world by the Institute for Energy Economics found that none worked well and that most had been commercial and technological failures. It warned that the UK's CCS projects risked becoming a bottomless pit.
Bottomless it may be, but Miliband is still throwing billions into it. His barmy dash to Net Zero is the most expensive, self-inflicted wound in modern British history, penalising struggling households, killing industry, stifling economic growth, deepening regional inequalities.
It has become the most efficient system for taking money from the poor and giving it to the rich since feudalism.
A wise government would see Orsted as a wake-up call. Time to put a halt to further wind power while better ways of pricing energy are devised and the possibilities of new technologies more clearly seen.
Note 15
Offshore wind is being developed around the world, particularly rapidly in China. In high latitude countries like the UK it will continue to provide inexpensive electricity with direct CO2 emissions. The UK has a strong position in this industry and backing away now would risk large numbers of UK jobs and experts and would increase the price of our electricity.
Instead, this Labour government blithely continues to feed the monster even while pleading poverty on so many other fronts that do require government cash.
I suspect it is largely because Keir Starmer knows nothing about energy policy and doesn't understand the folly of what is happening on his watch. If so, he will rue the day. Allowing Miliband to continue with his free hand will end up being the biggest nail in Starmer's political coffin.
Chris Goodall, chris@carboncommentary.com, +44 (0)7767 386696
September 1 2025
[1] https://www.economist.com/business/2025/08/28/how-much-trouble-is-the-worlds-biggest-offshore-wind-developer-in
[2] https://www.economist.com/business/2025/08/28/how-much-trouble-is-the-worlds-biggest-offshore-wind-developer-in
[3] https://orsted.com/en/company-announcement-list/2025/05/orsted-to-discontinue-the-hornsea-4-offshore-wind--143901911
[4] https://orsted.com/en/company-announcement-list/2025/05/orsted-to-discontinue-the-hornsea-4-offshore-wind--143901911
[5] https://www.reuters.com/sustainability/climate-energy/offshore-wind-developer-orsted-q1-beats-forecasts-2025-05-07/
[6] https://us.orsted.com/news-archive/2024/12/amanda-dasch-selected-as-orsted-region-americas-ceo
[7] https://www.blackridgeresearch.com/blog/top-wind-turbine-manufacturers-makers-companies-suppliers-uk-united-kingdom-england
[8] The £100 figure comes from analysis I have carried out of data from the UK electricity system operator, NESO. This data was used to create the regressions in the previous article on this web site.
[9] https://www.gov.uk/government/publications/contracts-for-difference-cfd-allocation-round-6-results/contracts-for-difference-cfd-allocation-round-6-results-accessible-webpage
[10] https://assets.publishing.service.gov.uk/media/6556027d046ed400148b99fe/electricity-generation-costs-2023.pdf
[11] See figure 1 in https://www.gov.uk/government/consultations/network-charging-compensation-scheme-uplift-for-energy-intensive-industries/energy-intensive-industries-eiis-consultation-on-the-proposed-uplift-to-the-network-charging-compensation-scheme-for-energy-intensive-industries.