New record for UK renewables output
Renewable energy provided 13.4 GW, or 43%, of British electricity at 2pm on Saturday 6th June 2015. I believe this is a new record.
A windy day, combined with strong sun and low weekend levels of demand meant that fossil fuels delivered only 26% of total supply in the early afternoon. The remainder was delivered by nuclear, imports and power from the UK’s storage reservoirs in North Wales and Scotland.
The glut of wind and solar power almost pushed coal-fired stations out of the picture. At 3pm, coal was providing only 7% of British electricity, a total of just over 2.3 GW. I think this is also an unprecedented low and something to be actively celebrated. I don’t have the precise information but I believe only one coal-fired power station – Drax – was operating. If the country chooses to invest in wind, solar and other renewables, it can push coal-fired generation out of the generation mix completely.
Summer days that are both windy and sunny are rare. In no sense were the daylight hours of Saturday 6th June 2015 typical. But it did provide an inspiring moment that showed how renewables could eventually replace fossil fuels.
At the moment I don't think anybody monitors the share of renewables in UK generation. In Germany, this information is provided every hour via the EEX power trading exchange and it would be sensible to do the same thing here.
The chart below shows the makeup of supply from 9am to 9pm on Saturday. (Because of the really strange way that the UK monitors electricity output, I’ve had to list the main assumptions in the paragraph at the end of this note).
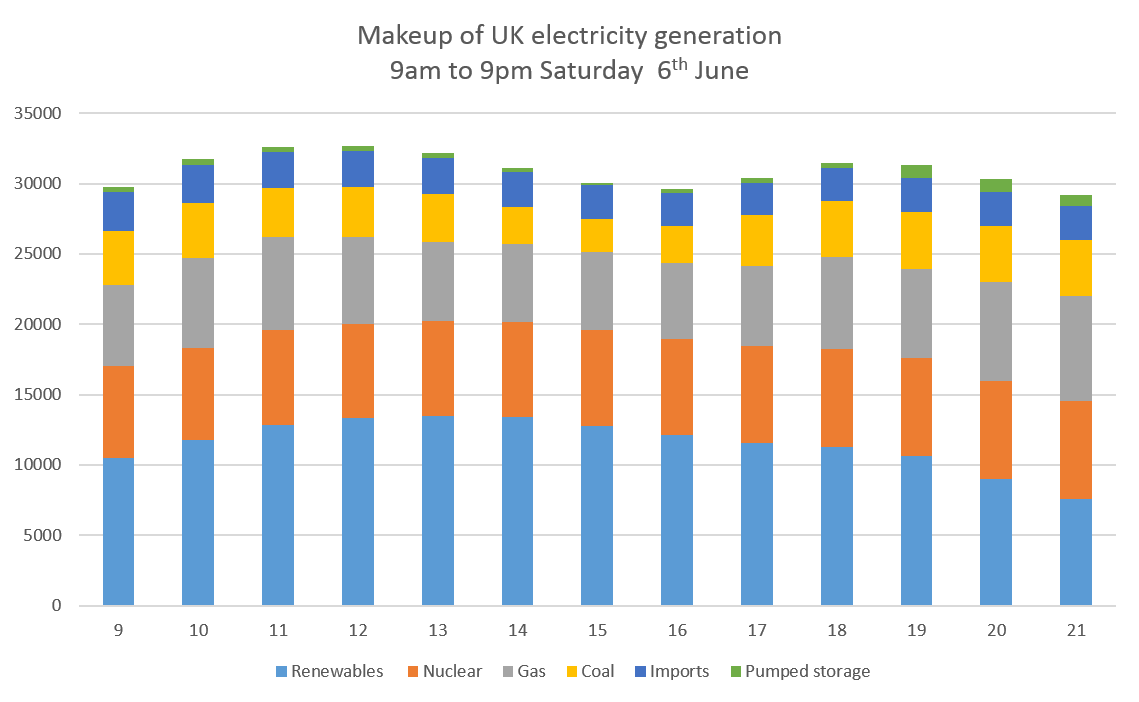
The left hand axis is Megawatts (MW). A GW is a thousand MW.
What share of total electricity output was provided by renewables during the day? My estimate is below.

Hours from 9.00 to 21.00 (9pm)
Notes
1. The UK system doesn’t measure solar PV as a separate source of electricity. It ‘sees’ PV as a reduction in demand for the conventional power stations and big wind farms. So I have added my estimate of PV output (generated at www.solarforecast.co.uk) to the measured UK figure. Similarly, I have added National Grid’s estimate of output from small scale wind farms that also aren’t directly measured. This might well be an inaccurate figure.
2. I have assumed that Drax’s biomass units are the source of output described as ‘Other’ by National Grid. The figure is about 1 GW for most of Saturday, roughly equivalent to the capacity of the units at Drax.
3. Renewables include grid connected wind, embedded wind, PV of all sizes including domestic, biomass principally at Drax's 2 biomass units, and non-pumped storage hydro.