The time needed for Energy Transitions
Summary
The standard view is that the switch to an energy system based on renewables will take at least half a century.
This opinion is largely derived from Professor Vaclav Smil's work on previous transitions from one fuel to another. We have all gone on to assume that the future will be like the past.
In contrast, I argue that the growth of solar PV, in particular, will not be restrained by the forces that held back new fuels in the past. Of course, nobody actually knows how rapid the growth of renewables will be but my purpose in this note is to suggest that Smil's view may be incomplete and that solar and wind will continue to grow at far faster rates than he suggests are possible.
The time needed for energy transitions
Energy transitions from one fuel to another are thought to be inevitably slow. As a result, everybody - but particularly those in the fossil fuel industry - says that the move to near-100% renewables is going to take at least a couple of generations. If true, the world is heading for more than 4 degrees of warming.
Can we make the transition happen faster? In this paper I try to make the case that the conventional wisdom may be wrong and the switch could take place far faster than the previous moves from wood to coal, coal to oil or oil to gas.
Readers of my book, The Switch, have written expressing surprise at my optimism. This long note is attempt to respond to these criticisms. I apologise for the length.
The widespread view that the transfer between one fuel and another takes over 50 years is almost exclusively derived from the one work of one man: Vaclav Smil, now a retired university professor from Manitoba, Canada. Smil is the doyen of energy historians, a very small group of people who have looked carefully at how the source of our fuels has changed over the centuries.

Professor Vaclav Smil, www.vaclavsmil.org
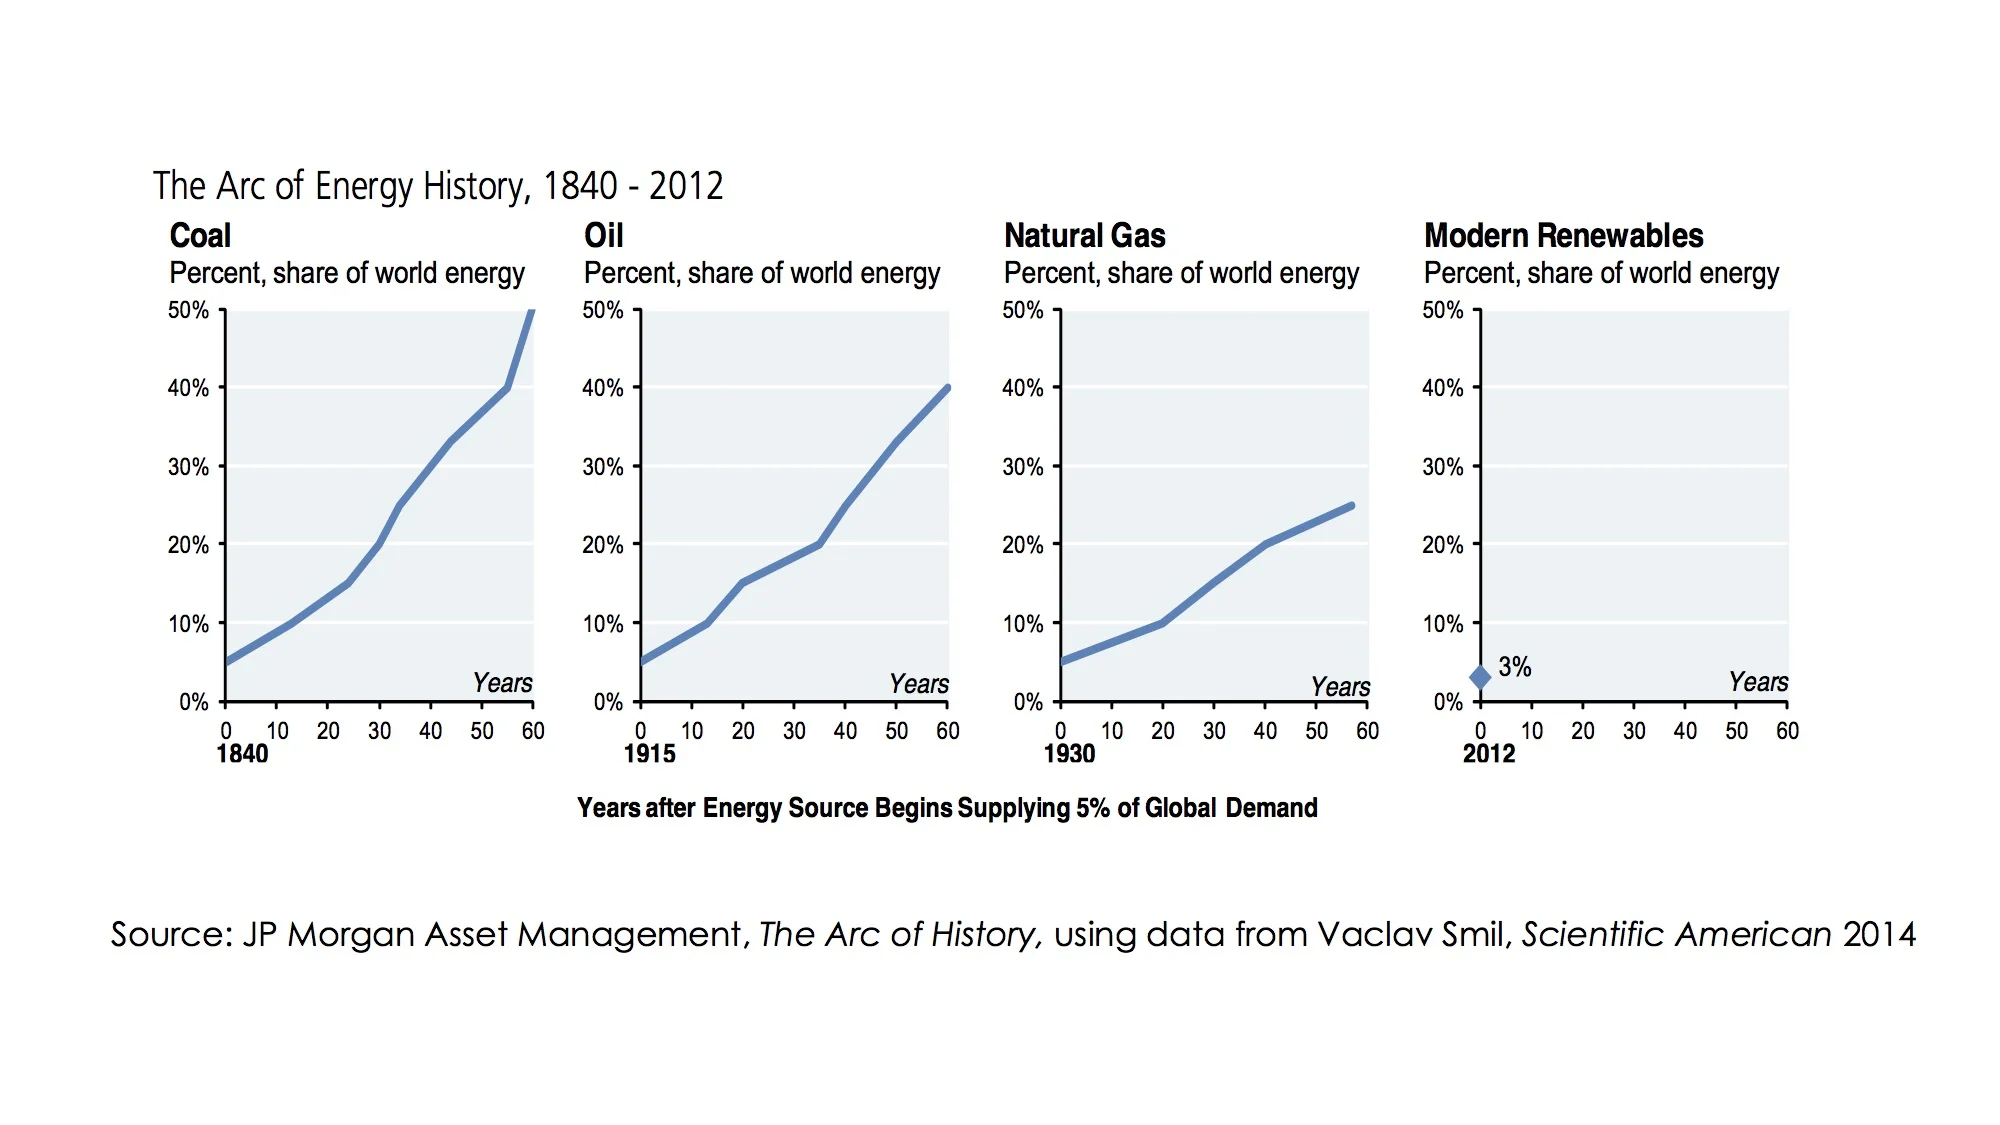
His well-researched and simple charts show how coal replaced wood, then oil pushed out coal and finally gas rises to importance. These graphs merge data from all the countries around the world to show how global shifts took a very long time. [1]
Smil’s work - academically rigorous and highly researched – is very rarely challenged. His view has become almost untouchable, perhaps partly because Bill Gates refers to it frequently and with obvious reverence. And over the years Smil's work has been aided by his attacks on some very easy targets: the renewables enthusiasts who have hailed the dawn of a fully low carbon era some decades too soon. Their premature announcements of the end of the fossil fuel era have made Smil's scepticism seem very sensible. I suspect another reason may also be that many powerful companies and institutions need Smil to be correct about the time taken for transitions. As the eventual inevitability of a 100% low carbon world becomes more and more obvious, those with an interest in prolonging the fossil fuel era hold on to the Smil hypothesis, much as a toddler keeps a comfort blanket by his side.
Today, even oil companies admit that the future will eventually be dominated by solar (for example, Ben van Beurden, the CEO of Shell during autumn 2015) but also say that the transition will take many decades.[2] Fund managers heavily reliant on the dividend stream from fossil fuel businesses similarly secretly wish for a slow shift. Indeed, many of us have a tendency to reject the possibility that the transition to renewables will be quicker, more disruptive and painful than the smooth and continuous - but nevertheless slow - growth shown in Smil’s unthreatening charts. Smil himself is openly sceptical about the rate of future growth of renewables and his many followers often quote his words.[3]
…’even a greatly accelerated shift towards renewables would not be able to relegate fossil fuels to minority contributors to the global energy supply anytime soon, certainly not by 2050’
Put at its simplest, the Smil view is that the maximum rate of global growth over the longer term of a newly arrived energy source is about 9% a year. In the world of the 20th century - in which energy demand was rising an average of 3% annually - this takes a fuel’s share from 5% to 40% in fifty years. The conventional wisdom is that solar, wind and other renewables are inevitably bound by the same rule. Growth is capped at 9% per year by the same forces that held down coal, oil and gas increases.
In the past half century, the growth rate of solar PV has averaged about 40% per year. If yearly increases stay at the same rate, PV alone would take its share of global energy supply from about 0.3% today to 50% in about 16 years. This is the wonderful effect of rapid compound interest. Wind has also grown rapidly, and together with PV possesses the capacity to push global energy to be predominantly renewable in little more than a decade.
Very few people believe this will happen. And the majority opinion may well be right about the need for at least a half century to pass for a new energy source to become dominant. Nevertheless, I want to test the case; is the evidence against the possibility of a more rapid renewables transition quite as clear as Smil and his followers suggest?
We have three main lines of attack against the prevailing pessimism.
1) Smil’s numbers refer to the world as a whole. He tracks, for example, oil’s share of global fuel use and says that it rose from 5% in 1915 to about 23% in 1965. But fossil fuels are unequally geographically distributed and supply took time to diffuse across the globe. If we look at changes in individual countries, the pattern is very different. Growth in the use of particular fuels has often been strikingly fast and far quicker than Smil asserts is possible. The growth of renewables can be far more geographically coordinated because both PV and wind are available in far more countries than oil, coal or gas. In fact they are almost universal. No other fuel is.
2) In the past, energy switches happened slowly because industries had to build new infrastructures and invest in large amounts of extra capital equipment to enable the new energy source to be useful. The rapid growth of oil, for example, only happened when mankind had developed the internal combustion engine and set up businesses as diverse as car assembly and tyre production. The requirement to change the whole system in order to exploit a new source of energy inevitably slows the transition down. Will the world need to invest similarly in huge and expensive supporting infrastructure to exploit renewables?
3) The growth of fossil energy sources may have been held back because of high costs. Renewables have certainly been more expensive in most parts of the world until the last few years. Will the continued downward shift in solar and wind costs enhance the rate of transition, simply because renewables are cheaper than the alternatives, either now or imminently?
Line of attack against lethargic transitions 1.
Might the growth of energy technologies be quicker than the conventional view says is possible?
Coal was the dominant source of energy in the UK as early as 1700.[4] That is, even before the beginning of the industrial revolution it produced more kilowatt hours of energy than wood, wind, draught animals and human food taken together. Put at its simplest, it was picked off the beaches near Newcastle (north-east England), shipped to cities such as London for heating homes and, soon after, to Cornwall to feed the steam engines used to pump water from mines. Most other places around the world didn’t have abundant near-surface coal and were far more reliant on wood. It took the development of underground mines, canals and railways to spread the use of coal as an energy source around the world.
As the Smil charts show above, it wasn’t until 1840 that coal was 5% of global energy supply (and a large fraction of that 5% was actually consumed in the UK, then the only fully industrial country in the world). By that time, coal was already just under 90% of total energy supply in the UK, and its scope for further growth in its share was inevitably minimal. Simply as a matter of arithmetic, this slowed down the measured rate of increase in coal’s global penetration. So it is unsurprising that Smil’s global coal transition came much less rapidly than it actually occurred in individual countries.
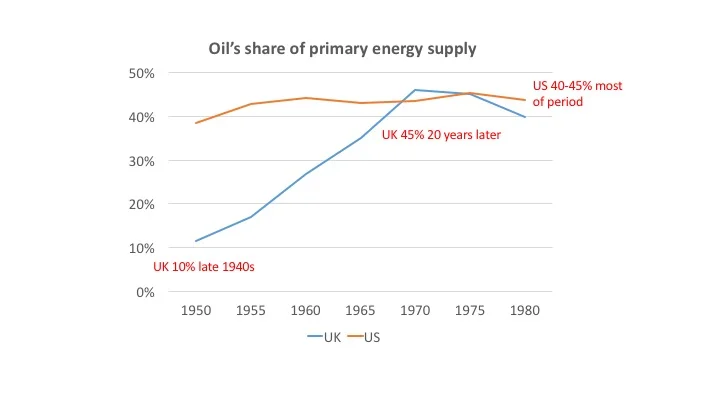
A similar process can be seen in the case of oil. The chart below shows the share of oil in the energy mix of the US and the UK between 1950 and 1980.[5] The US percentage barely changes in the period at around 40-45%. Oil was produced in large volumes in the US and it was already relatively cheap. In 1950 the UK was short of foreign exchange and only about 10% of its energy need came from imported oil.
As the economic circumstances improved, the share of oil rose very rapidly, reaching a higher share than the US by 1970, only twenty years later. (North Sea oil was not discovered until 1969). The UK’s transition to oil was far faster than suggested by the Smil hypothesis and it pushed coal from 85% of the energy mix down to less than 50% by 1970. What Smil says took 60 years globally (5-40% in the case of oil) took 20 years (11-45%) in the UK.
To make the point in a slightly different way, the transitions to both coal and to oil occurred in one or two large countries much earlier than the rest of the world. The share of oil or coal in these markets was already high by the time the wider upsurge in fuel use began, largely because these countries were endowed with easily extractable oil and gas. That means that the share was already so high that it couldn’t rise much further. This – purely as a result of arithmetic – will always depress the apparent global rate of growth.
Let’s briefly look at another example of the distorting impact of looking at the world as a whole rather than studying individual countries or regions. World coal use rose about 2.5% a year between 1980 and 2012, approximately the same as global GDP growth. Coal’s share of world energy use remained roughly constant. However that stability disguised a divergence between a virtually static market for coal in OECD countries and 4% annual growth in non-OECD economies. More specifically, China’s coal use almost tripled between 2000 and 2013, growing almost 10% a year. The country now burns half the tonnage mined worldwide and almost two thirds of its primary energy comes from coal.[7]
Natural gas provides more examples. Before large scale liquefied gas transport started in the 1990’s, international trade was limited. Some pipelines ran from Russia to European and to near-Eastern countries but most natural gas was consumed in the country where it was produced. Those places without gas tended to see a small proportion of their energy needs met by this fuel. This is a large part of the reason why gas took 40 years to move from 5% of global energy supply in 1930 to 20% in 1970.
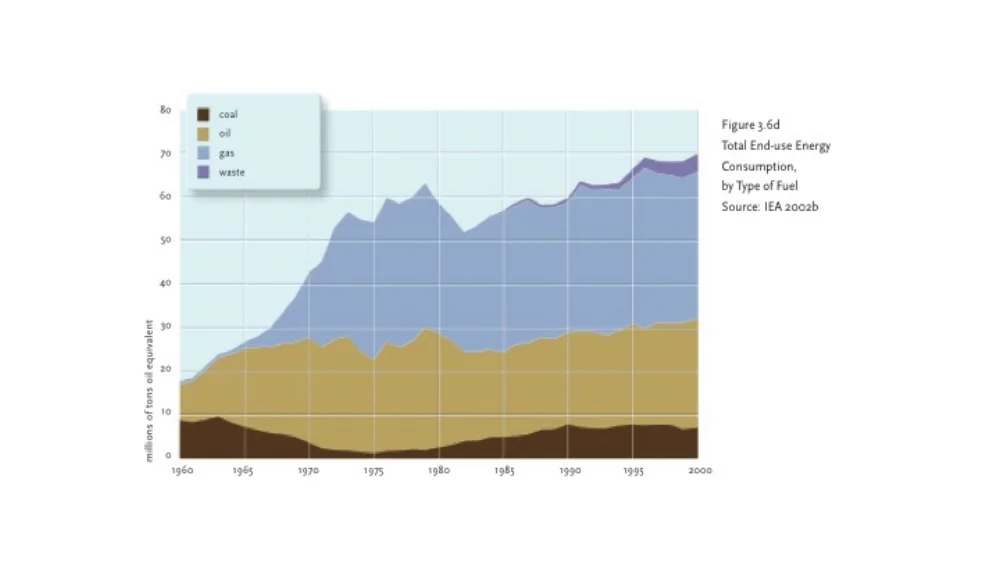
But the pattern in individual countries that did have easy access to natural gas is often very different. The chart below is extracted from a book about the growth of natural gas in the Netherlands. In 1959, the Dutch discovered a huge gas field in the north of the country, near Groningen.[8] It produced large volumes of gas at a low cost. Use of the fuel was limited until about 1965 but within 10 years gas was responsible for over 50% of the total Netherlands energy supply.
Composition of Netherlands energy supply 1960 to 2000
In the UK, the arrival of North Sea gas in the late 1960’s also produced a rapid rise in the share taken by this fuel. From 1% of total energy use in 1969, the UK moved to 18% derived from gas only 10 years later. This wasn’t a full ‘energy transition’ but it was far faster than the conventional view says is possible.
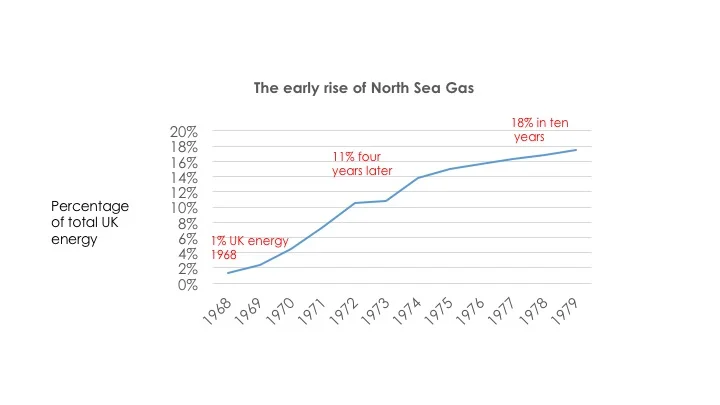
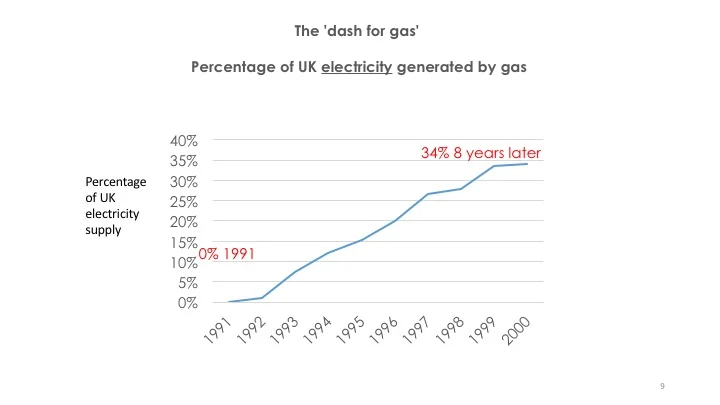
Those figures are energy as a whole, covering the decade of the 1970s. Gas saw another burst of growth two decades later as power generation was swiftly switched from coal in what was known as ‘the dash for gas’. This took the fuel’s share of electricity production from nothing in 1991 to 38% ten years later and, coincidentally, meant that gas also provided 38% of all energy use by the turn of the millennium. This was the full transition – gas moved from insignificance in 1970 to well over a third of all fuel use thirty years later. The UK is a large country and shifted far more rapidly to a new source of energy than now seems to be thought possible.
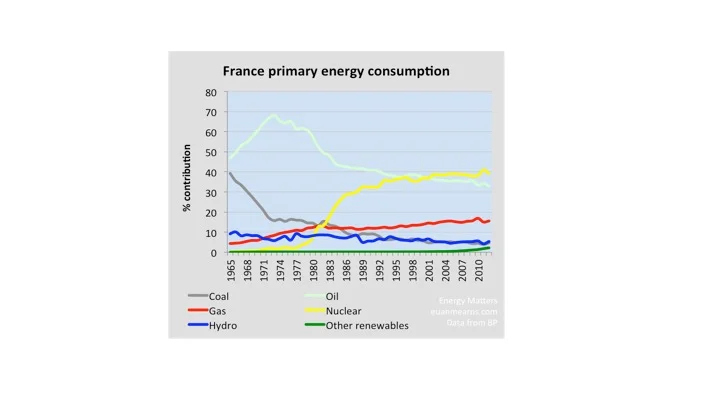
France saw a similarly rapid switch as it brought nuclear power into play around 1980. Less than fifteen years later, nuclear electricity represented over 35% of total national energy demand.[9] This had, of course, required huge capital investment in building reactors around France.
Line of attack against lethargic transitions 2
The clean energy transition will not be held back by the need to build new infrastructure
I am going to assert two things. First, that previous energy transitions were slow in part because each fuel only became fully valuable after a network of infrastructure and machines was developed to exploit the energy it contained. Second, by contrast, the clean energy revolution does not require much additional complementary investment. Solar PV and wind supply electricity, and the capital investment to use this energy source is already in place in the form of transmission and distribution line. Similarly, batteries can be simply plugged in to the electricity system. Long-term storage - which will be needed in huge amounts in high latitude countries - can be provided by ‘green’ natural gas and liquid fuels, which will be created using renewable energy. This energy can be stored in the existing gas and oil infrastructures.
How did the unavailability of complementary infrastructure slow previous transitions? Countries, continents and the world swing from one fuel to another because the rising energy source is either cheaper or more convenient, or both. But the switch isn’t instantaneous because the new fuel usually requires huge investment in finding and extraction. Then a further prolonged burst of capital spending is required to provide the machines to use the new source of power and build the support infrastructure, such as pipelines and storage tanks, to use that energy.
The best known early example, of course, is the transportation of coal in the United Kingdom. Before the advent of canals, the price of coal in cities was pushed up by high transport costs. In the classic anecdote of the Industrial Revolution, the opening of the Bridgewater canal in 1764 halved the price of coal in Manchester within months (although I have to admit that my attempts to find hard information to support this story have failed). Without transport links, energy transportation of fuels is expensive and this has delayed the growth of all alternative energy sources since the beginning of the coal transition.
It is also important that machines are available to productively utilise the new fuel. For coal to be useful to industry, engineers also had to develop machines which turned energy into motion. Newcomen’s steam engines of the 1720s began the process but it wasn’t until the work of James Watt sixty years later that coal began to be turned into useful power with reasonable efficiency.
Similarly, oil needed to be refined before it could be used as a transport fuel, which eventually replaced kerosene for lamps and heat as its dominant end use. It also required vehicles to use the gasoline produced. The internal combustion engine can be said to have been developed (in France) about the same time as the first wells were drilled in the US in the early 1870s. But in 1900, forty years later, there were said to be only about 8,000 cars in the US, and more of these were battery-powered than used internal combustion engines.[10] The relatively slow diffusion of cars held up the transition to oil. They were expensive and unreliable. Mrs Ford continued to drive her favourite electric car even after her husband had started producing the Model T in 1908. In the decade from 1900, car sales grew sharply and by 1910, there were about half a million on US roads. Four years later there were 1.7 million.[11] Unsurprisingly, US oil production quadrupled in the period.
So even in the US, blessed in the early years by easy-to-extract crude oil, took time to fully use the resource because the machines to combust the fuel took time to develop. In fact it wasn’t until 1950 that oil overtook coal as the single most important fuel source in the US, eighty years after the first well was drilled.[12]
Oil’s rise around the world was held back by the need to invest in refineries to produce motor fuel, large farms of oil tanks to store the petrol and diesel, garages to sell cars and retail the fuels and, of course, cars to use the fuel. It is no wonder that the transition took decades across the globe.
Countries which discovered big gas fields sometimes exploited the new source very rapidly. The Groningen field mentioned above enabled The Netherlands to get natural gas out to the bulk of the population remarkably quickly. Even still, this was not a simple process. Most urban areas had a gas works that made ‘town gas’ from coal and pipes that carried the fuel to homes. So it might be thought that all the suppliers had to do was to switch from the coal gas, made in town gas works, to the new source. In actual fact, a new long distance grid had to be built and every single cooking stove, hot water boiler and heating appliance was adjusted or replaced. (I am not quite sure of the reason for this but I suspect it was to do with the low calorific value of Groningen gas, which contained large amounts of nitrogen).
The photograph below shows the conversion workshop at the Feijenoord Municipal Gas plant. Fitters are replacing components of domestic cooking stoves. This was not a simple transition but it still occurred remarkably quickly.
Fitters at a gas plant in the Netherlands in about 1960

The economic benefit of natural gas in the Netherlands was substantial and the resource was exploited very rapidly indeed, providing 50% of the country’s energy within 10 years. This was achieved even though the transition was complex and involved real costs and dislocations. For example, people lost their kitchen cooker for a few days while the burners were replaced. No similar obstruction stops solar and wind energy replacing coal and gas as the source of electricity.
Smil himself notes the extraordinarily fast transition to natural gas in the Netherlands. However also he wrote that ‘only small economies endowed with suitable resources can undergo very rapid resource transitions’.[13] He appears to be admitting that the Groningen field was so large that it made possible a switch for the entire economy. It’s worth mentioning that the sun is delivering 6000 times as much free energy at this moment as the world needs. Everywhere with decent sunshine – and that means at the very least 80% of the world’s population - has the ‘suitable resources’ that Smil says are the precondition for a fast transition.
Even Professor Smil would not argue that the UK is a ‘small economy’. In the latter part of the 20th century, it was responsible for between two and three percent of the world economy. But the rise of North Sea gas in the decade after 1969 from 1% to 18% of total energy use occurred despite the large changes to infrastructure that were needed. As in the Netherlands, the discovery of accessible fields brought about the rapid development of a long distance pipeline network and a similar adjustment to each and every gas appliance in the country, in this case carried out gas fitters employed by the nationalised gas supplier in the home. (One of my earliest memories is standing in the doorway of my grandfather’s kitchen watching a couple of rather oil-stained individuals remove parts of his cooker, replacing them carefully a few minutes later).
The point is this: past transitions were made complicated by the need to develop distribution systems and invest billions in the machines and appliances that used the fuel. This isn’t the case with solar and wind. They tap into an existing architecture of distribution and the purchasers of electricity need no new appliances to cope with solar-generated power. This makes a faster global transition far easier to accomplish than the rise of coal, oil or gas.
Of course solar and wind electricity do have different characteristics to electricity from gas. As sources of energy they are unreliable and highly variable. The electricity system therefore needs to put capital into devices that help us deal with the intermittency of renewable power. This both means storage batteries and, as importantly, computer-based technology that manages energy demand so that it aligns with available supply (usually now called ‘demand response’). But the investment required is a fraction of what the UK and the Netherlands needed to bring gas to the bulk of the population within a few years.
Although most transport and domestic heat supply will be fully electrified, the UK and other high-latitude countries also need to provide renewable gas and oil. These ‘green’ fuels will be manufactured by upgrading carbon dioxide to gases and liquid fuels using large amounts of energy, almost certainly in the form of renewable electricity. We will need chemical industry infrastructure to carry out the transformations from simple to more complex and energy-rich molecules but the cost of this will be a small fraction of the capital requirements for generating the electricity in the first place.
Line of attack against lethargic transitions 3
The price of low carbon energy
The UK – with poor sun but good wind – has just published estimates of the current cost of renewables compared with electricity generated by natural gas. Perhaps surprisingly, the government thinks that the costs are broadly comparable, even at the currently low wholesale price of gas. (However, the gas costs do include a figure for the price of carbon).
For projects completing in 2020, electricity generated by gas is seen by the UK as costing £66 per megawatt hour. (This includes £19 of carbon costs but also assumes an extremely optimistic 93% utilisation rate. The real utilisation rate is unlikely to be more than 80% for mid-ranking plants). Large scale PV is put at £67 and wind at £63. At a 3.5% real interest rate (probably about today’s actual cost of capital), the figure falls to £53 for PV and £49 for onshore wind.
The UK is a relatively cheap place to generate electricity from gas and expensive for solar, because of poor insolation levels. It ought to be inexpensive to construct and operate wind turbines here but restrictions on size, planning constraints and grid connection costs have raised the price to well above other countries.
Nevertheless, UK renewables are now no longer more expensive than gas-powered electricity for projects now in early planning.
In other countries, usually with more expensive gas (with the exception of the US) and better solar radiation, PV is often already significantly cheaper. Some recent auction prices have seen PV at less than 3 US cents per kilowatt hour, or $30 per megawatt hour. These prices are lower than the fuel cost alone for the gas burnt in a combined cycle gas turbine (CCGT). Solar PV is already the low-cost way of generating electricity in large parts of the world, both in the form of large fields of panels and in tiny installations in towns and villages without electricity.
PV continues to fall in price, with no end in sight. Benefiting from a steep learning curve, PV will the lowest cost way of generating electricity almost everywhere around the world within a decade. Wind is also getting cheaper by the month, although the rate of decline is not as great as solar.
The argument that the energy transition to non-fossil fuel sources will inevitably be a half century long because there is no financial benefit to the use of renewables is wrong.
Conclusion
The conventional wisdom remains that the next energy transition will take as long as previous shifts. Even though many countries have committed to deep and rapid decarbonisation, no-one quite believes their plans. The comfortable view that PV (and wind) will copy the slow rate of growth of gas and oil continues to be dominant.
I’ve tried to suggest that the standard view of the slow transition may be flawed. Switches in individual countries have been far faster in the past than the simple global numbers would suggest. These rapid transitions have often been fuelled by low cost local sources of energy. Solar energy is global and so provides the raw fuel for a swift move to a new dominant energy source.
Solar, wind and other renewables require no new infrastructure. They simply supply into the existing electricity network. However, the need for storage, or ‘dispatchable’ alternatives to wind and PV, does increase capital requirements for the transition.
Wind and, particularly, solar are now as cheap, or cheaper, than the fossil alternatives. There is therefore a strong financial incentive to roll out more PV in many parts of the world. This incentive will not reduce at any point in the future. Wind and PV are getting cheaper month by month while fossil fuels are tending to get more expensive to extract.
No-one knows how the changes to the energy system will unfold. But the notion that transitions from one fuel to another inevitably take a half century or so is likely to be wrong. As Paul Dodds, an academic at University College, London, says [14]
Technological revolutions can be implemented very quickly when there is a clear business case and benefit – publically and privately. Transitions are very slow when there isn’t.
Even in as tiny an academic discipline as energy history, there are people who dispute Smil’s confident but pessimistic assertions. Paul Warde, a Cambridge historian, is a younger upstart questioning the prevailing view that transitions have a predictable and almost mechanically determined path. In a recent oral presentation on Vimeo he goes on to suggest that the dead hand of conventional wisdom on changes in energy supply may be reinforced by the reluctance of people in the energy industry to change their public positions on the future of supply and demand. [15]
Did people get things right? Unfortunately, the fact is that most of the long-term energy predictions that we have ever made are wrong, and frequently they’re quite badly wrong.
…Either as people or institutions, people tend to get wedded to a particular model of prediction…There are big career implications from abandoning a position that you have strongly taken.
It may be time to start more actively questioning the prevailing wisdom on energy supply and, as Warde suggests, allow a little more intellectual flexibility into our thinking. The growth of all new products, energy or otherwise, is faster than a century ago as diffusion becomes easier and cheaper.
How long did it take to get the mobile phone to almost universality in the world? In 2000, there were about 740 million phones in the world, or one for every nine people.[16] Now there are more than 10 times as many. Global internet penetration grew from 6% to 43% in the same period. And these are not insignificant industries. The mobile phone market is now almost as big as the world’s energy business at over 4% of the global economy.
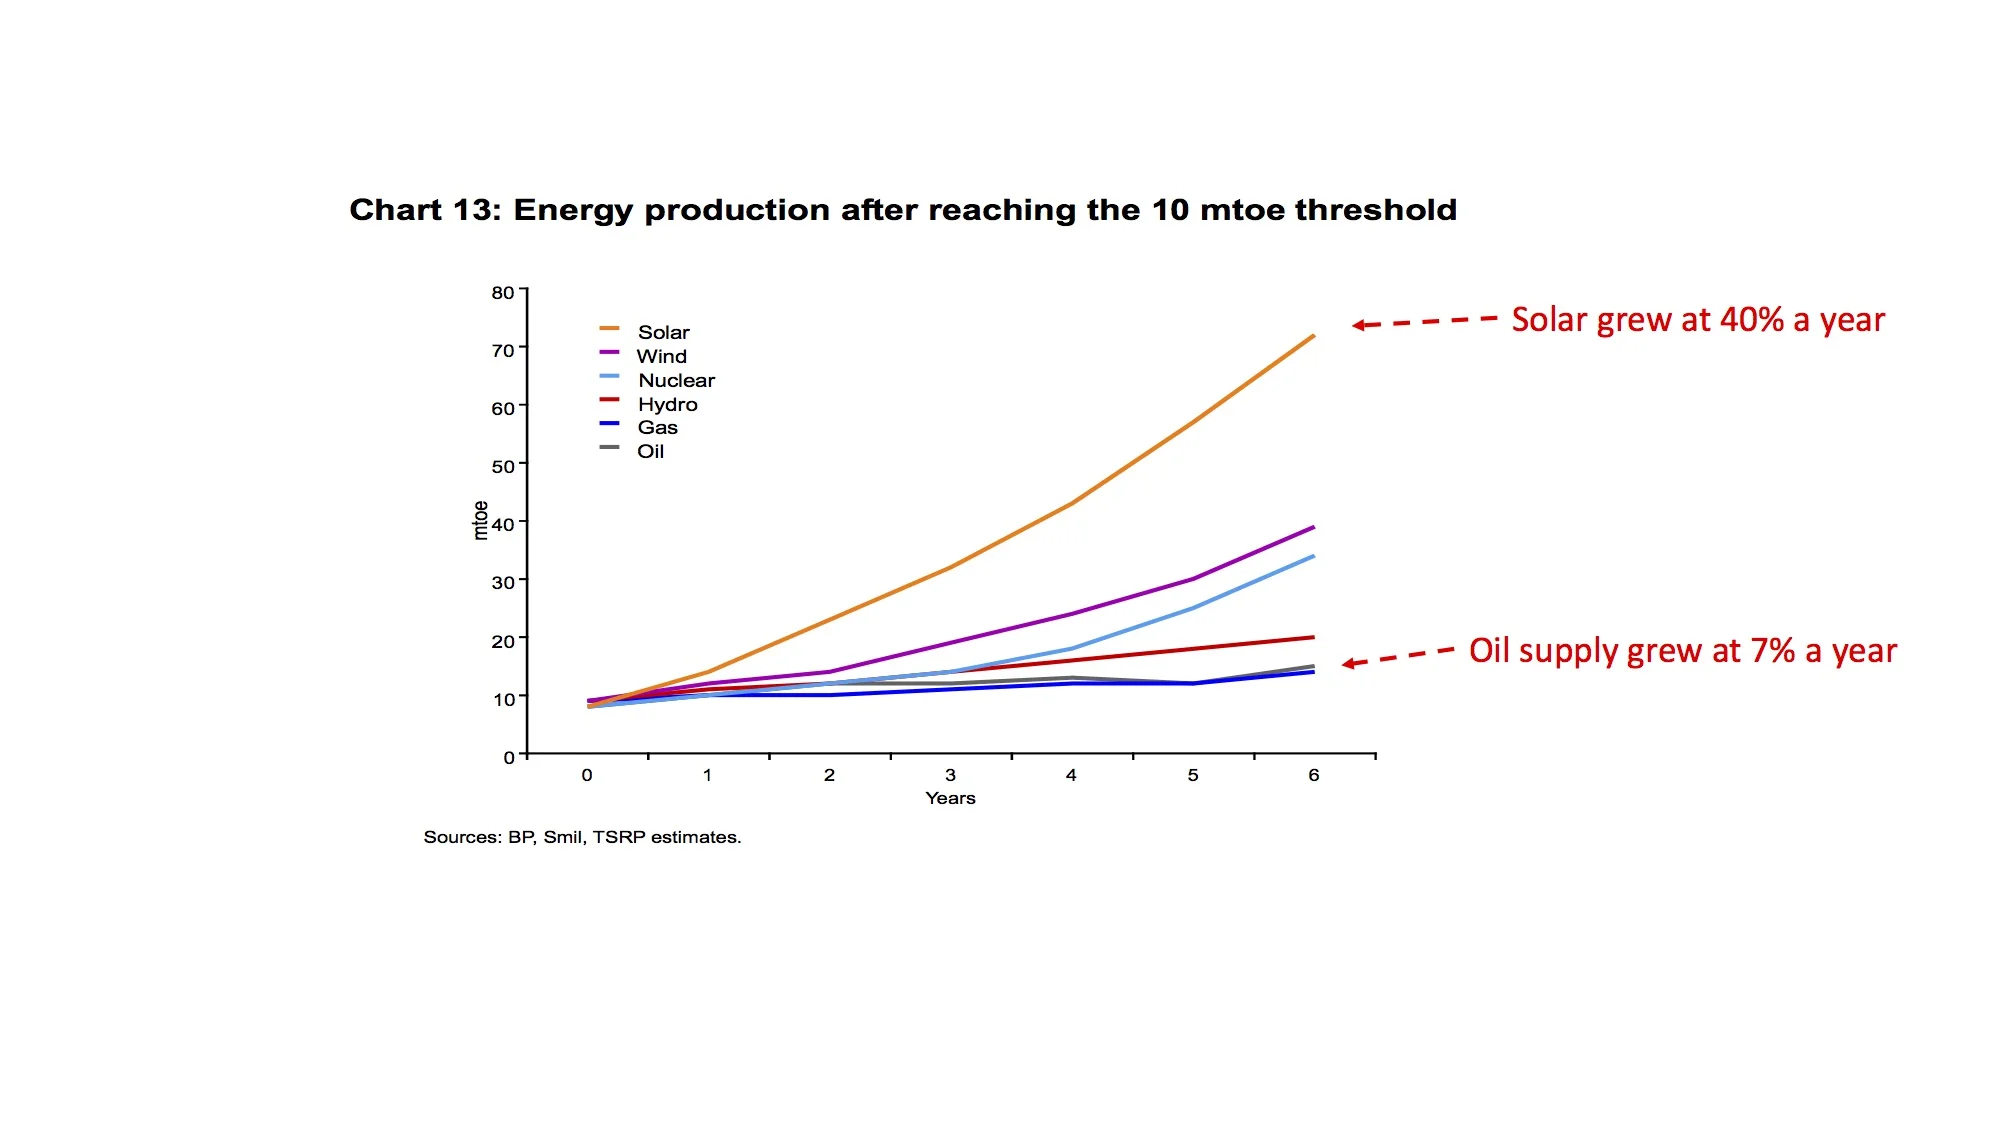
As the analyst Kingsmill Bond has shown in a recent paper, renewable sources have been growing several times as fast as other fuels at the same stage in their development cycle.
Growth after a fuel reached 10 mtoe (million tonnes of oil equivalent)
Perhaps we need to ask whether the fossil fuel industries are telling us that the transition will be slow simply because they want to stay longer in their current business, rather than facing the pain of building a new strategy in a world of zero carbon fuels.
[1] JP Morgan Asset Management, The Arc of History, using data from Vaclav Smil, Scientific American 2014: https://www.scientificamerican.com/article/a-global-transition-to-renewable-energy-will-take-many-decades/
[2] http://www.bbc.co.uk/news/business-34274352
[3] Vaclav Smil quoted in Daniel Yergin’s short paper from IHS ‘Do Investments in Oil and Gas constitute systematic risk?’, October 2016
[4] The information on the early dominance of coal in the UK is taken from Dr Paul Warde’s masterly analysis of British energy history in his long paper entitled Energy Consumption in England and Wales 1560-2000 (Naples: CNR, 2007).
[5] http://www.eia.gov/totalenergy/data/monthly/pdf/sec1_7.pdf. The data on the UK’s use of oil is taken from Warde op. cit.
[7] https://www.ief.org/_resources/files/snippets/chinese-academy-of-social-sciences-cass/world-energy-china-outlook-interim-report.pdf
[8] Natural Gas in the Netherlands: From Cooperation to Competition, Aad Correljé et al, Orange-Nassau Group, Amsterdam, 2003
[9] http://euanmearns.com/energiewende-germany-uk-france-and-spain/ Figure 11
[10] http://news.thomasnet.com/imt/2003/01/17/how_oil_refinin
[11] http://www.carhistory4u.com/the-last-100-years/car-production
[12] http://www.eia.gov/todayinenergy/detail.php?id=10
[13] http://www.vaclavsmil.com/wp-content/uploads/WEF_EN_IndustryVision-12.pdf?emailid=5655d14ccb56e60fc6447e23&segmentId=7e94968a-a618-c46d-4d8b-6e2655e68320
[14] https://www.bartlett.ucl.ac.uk/energy/docs/dodds-presentation-slides
[15] . (https://vimeo.com/185466482) I may have mistranscribed some individual words
[16] https://www.itu.int/en/ITU-D/Statistics/Documents/facts/ICTFactsFigures2015.pdf
[17] http://www.gsma.com/mobileeconomy/