How much electricity storage capacity does the UK need?
The first winter storm of 2025 has just passed over the UK, providing huge amounts of wind-generated electricity. This wasn’t the first time in recent weeks. From late July to late August 2025 we saw a consistent mixture of high winds and good sun across the UK. At the peak at about 11am on the 11th of September, these renewable sources provided more than 27.5 GW into the GB electricity grid accounting for approximately 70% of total needs. The purpose of this note is to estimate how much storage capacity will be needed in future to cope with periods of very strong supply such as we saw in that four week period.
Across the whole period from the morning of 25th August to the afternoon of 22nd September, the average production of wind and solar electricity was about 14.6 GW, representing over 48% of GB demand in the period.
The UK government has targets for expanding renewables capacity by 2030. Much of the expansion will take place in offshore wind, already the most important source of renewable power. And, moreover, experts believe that new offshore wind installations will obtain a significantly higher average load (‘capacity factor’) than existing offshore wind. Turbines are bigger and will be placed in areas of higher typical wind speeds. Onshore wind will also see improved ‘capacity factors’. Changes in solar will not be as sharp, although we will probably notice some improvements as very large installations are placed in the southernmost parts of England.
I looked at how much electricity would have been generated from 25th August to 22nd September 2025 if the target solar and wind capacity for 2030 was already in place. This period would have seen substantial and long periods of excess production. My purpose was to give a rough idea of how much storage capacity will be needed as the UK expands intermittent renewables.
A short note on how I made the calculations is appended below. But, to summarise, the conclusion is that at least 8 TWh of storage capacity would have been needed to hold all the excess electricity generated in this four week period in August and September. That would power the whole of GB for about 10 days at current rates of consumption.
As at September 2025, the UK has just over 10 GWh of batteries, or just over 0.1% of the storage capacity required in 2030 just to handle this single period of good solar and wind production. This assumes renewable targets are met and electricity demand stays constant.
If wastage is to be avoided, huge surplus such as we have just seen has to be stored so that it is ready for the inevitable periods of deficit that will follow, such as we see in the last days of September in this chart, when almost 2 TWh are needed. Batteries are unlikely ever to be able to store enough, even in progress in costs contains at very high rates. I believe gaseous hydrogen stored in underground salt caverns is likely to be the only viable storage medium for the huge quantities of energy needed to be held in reserve when solar and wind do not meet the needs of Great Britain.
Chart 1
Notes
1, I obtained half hourly production data for the days in August and September from the NESO generation database. This database estimates how much electricity came from each type of power source.
2, I multiplied the solar and wind installed capacity figures to the level that is likely in 2030, if government renewable installation targets are met. Notes 3 and 4 say how this was done.
3, In the case of solar, the capacity in 2030 is expected to be about 2.41 times the level in late summer 2025. I assumed no increase in production per unit of installed capacity. In other words, the capacity factor is held constant.
4, For wind, I used the UK government’s figures for the expected increase in capacity factors by 2030. Onshore = 25% to 36%, offshore 38% to 49%. To be clear, existing installations continue to achieve current capacity factors, new installations obtain the higher numbers.
5, From these numbers I was able to calculate what would be the output of wind and solar in 2030 in the meteorological conditions that we saw in August and September.
6, I then assumed that no other generation sources were operating and no electricity imports were flowing into the country. The single exception in my arithmetic is nuclear power, which remains at the level achieved in the two months of this year. The calculations therefore provide the smallest possible estimate of how much excess electricity generation will take place.
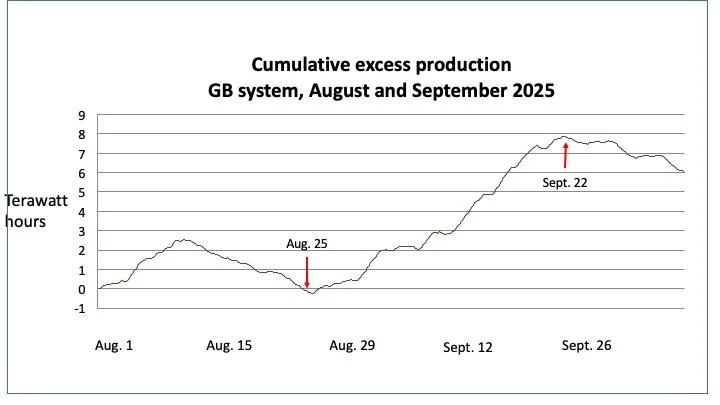
7, The chart shows that in the early weeks of August, wind and solar alone (+nuclear) would have been sufficient to meet all electricity demand. The surplus peaks on August 10th at about 2.5 TWh. Then the system swings into deficit, falling to a low of about 0.25 TWh on August 25th. At that point, therefore, solar and wind will not quite have provided enough electricity between August 1st and August 25th to meet the country’s total need.
8, But then a prolonged period of about four weeks of excess production starts. Almost all days see an increase in the surplus and it rises to around 7.9 TWh on August 22nd. The system has swung from a deficit of 0.25 TWh to a surplus of 7.9 TWh.
The weaknesses in the assumptions in this note.
1, I assume static electricity demand. This may or may not be implausible. Electricity use is still falling, despite the growth of electric cars. But this will change at some point as heat pumps, greater industrial use of electricity and rapid increase in EV numbers turn the decline around.
2, It may be that the collection efficiency of wind turbines does not increase as fast as the government predicts.
3, in the calculations I assume other sources of power, whether from gas, imports, biomass or other sources, are completely unused. This is clearly unreasonable but I made this choice to show that, even under extreme absence of other electricity sources, solar and wind will produce long periods of excess supply by 2030 and that storage will be necessary in amounts vastly greater than currently envisaged.