Renewables do unambiguously reduce wholesale power prices
We still hear assertions that adding renewables to the grid has increased the UK’s electricity costs. I looked at two sources of data and plotted one against the other to test whether there’s any truth in this.
1, The ‘next day’ electricity price for each hour in the period from 1st January 2025 to the early days of August 2025.[1] That’s about 220 days, covering the coldest period of the year and the heat of the summer. (In the UK, electricity prices are highest in the winter and fall to lower levels in the summer because demand is much lower). The source for this data was the research group Ember.
2, The percentage share of wind and solar electricity in total generation in each of the 220 or so days. The source was the GB network operator, NESO.
The analysis seeks to show whether or not days of high electricity price are associated with large or small shares of renewables[2] in total generation. For each day, I plotted the average hourly price of electricity against the share of solar and wind in that day’s total electricity generation. If more renewables adds to costs, the price of electricity should be higher when wind and solar are abundant.
Of course that is not the case; a day with wind or sun (or both) typically has a lower hourly average electricity price. And the differences are substantial, as the chart below shows. On average, if modern renewables provided 20% of the electricity in a particular day during this 7 month period, the price would be about £128 per MWh. A 50% day typically resulted in a £73 price, or £55 lower per MWh. A 50% rather than 20% renewables share is associated with a decline of over 40% in the wholesale price in the period I studied.
Figure 1
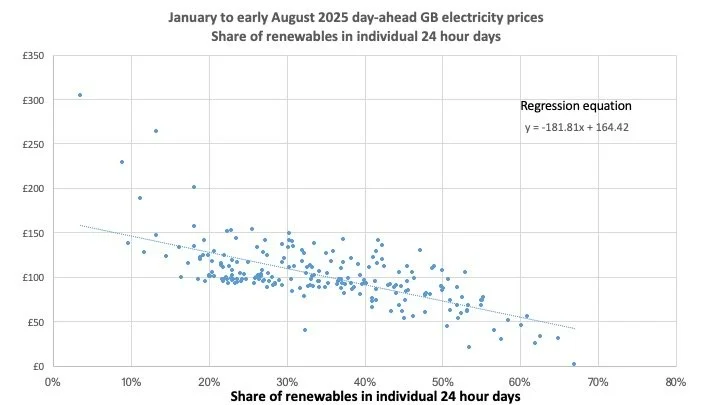
I have based this estimate on simple linear regression (a ‘trendline’) [3]. This is an unsophisticated approach, particularly since the chart shows that the correlation between renewables and price may not be properly linear. The visual evidence is that very low renewables shares (experienced mostly in a still January) are associated with particularly high prices that are well above the estimate produced by the regression analysis. In addition, days of very high renewables penetration as seen in the summer months seem to have lower prices than expected. These days sometimes saw wind and solar providing more than 50% of total power generation and prices far below the level projected by the regression line.
Another criticism that might be made of this regression analysis is that mixes months of typically high prices (January to March) with a period of much lower prices (April to August). If the winter had low winds, and the summer had high solar output, the apparent fall in price as a result of high renewables share would actually be caused by inter-seasonal variations, not the direct effect of increased wind and solar.
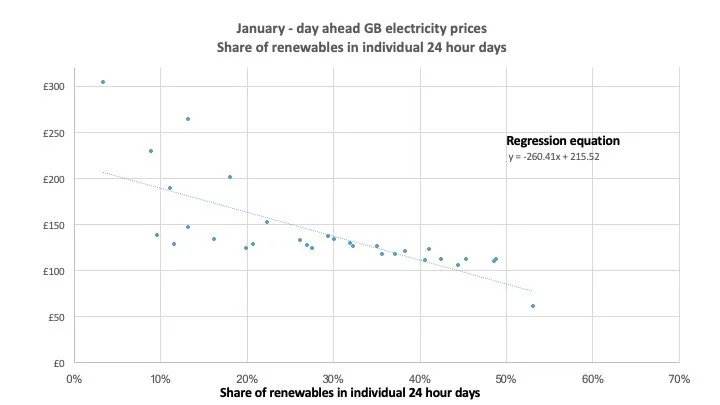
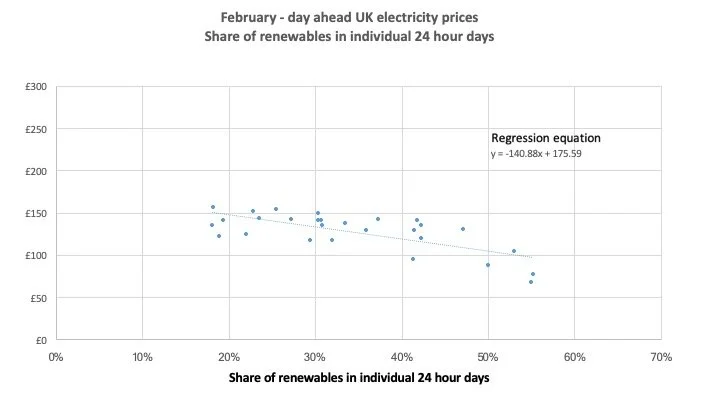
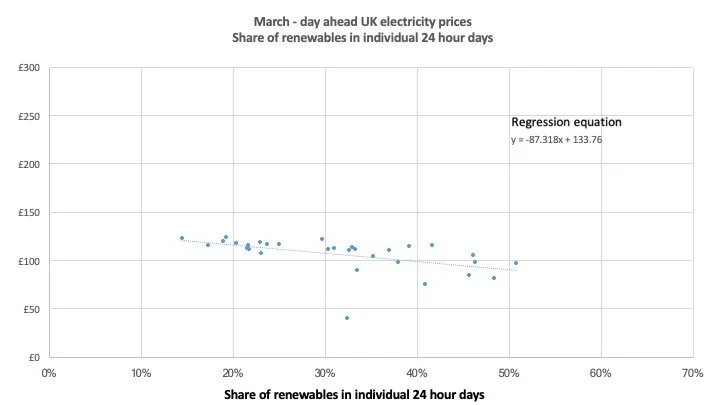
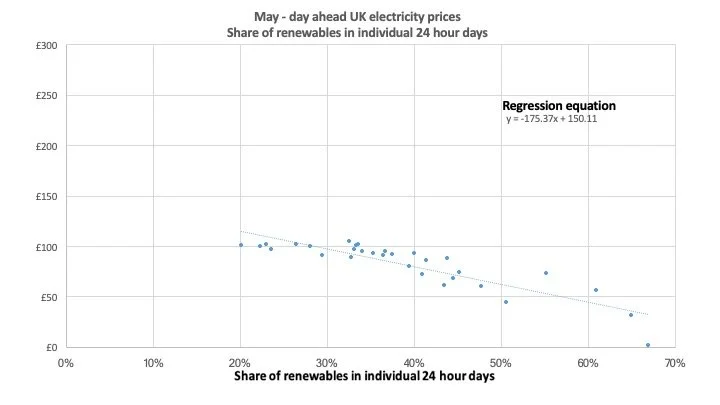
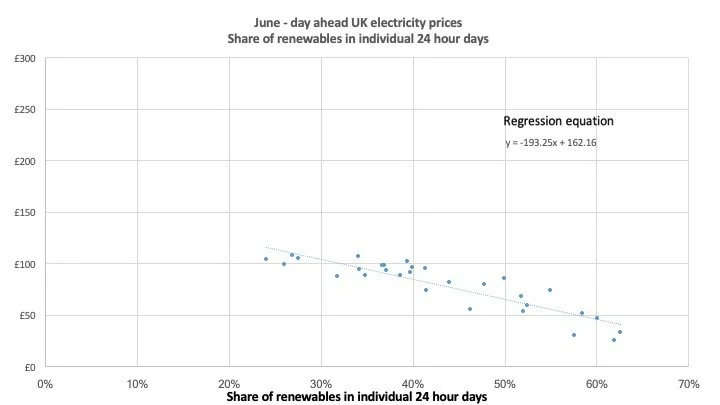
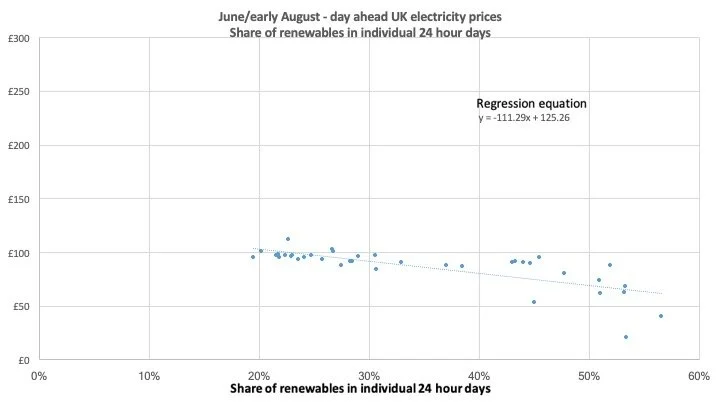
But, very largely, that is not what happened. The following 7 charts examine the relation between wind and solar percentage and the day-ahead price in each month of the period studied. In every month, higher renewables penetration is associated with lower prices. The fall in price as renewables move from 20% to 50% of total generation in each month is generally not quite as large as the main chart suggests but the effect of high wind and solar is still substantial.
In March and April, the fall in wholesale electricity price as a result of a 50% renewables share compared to a 20% share was £29 and £19 per MWh respectively. These were the low months; in May and July the figures were £58 and £64 respectively. January showed the largest effect of of a fall of £87 per MWh resulting from a renewables increase from 20% to 50% of all power production.
More renewables on the GB grid unambiguously reduces the wholesale price, typically by a large percentage. Absent any other effect as the UK continues to add wind and solar, power prices will come down sharply. This is, of course, what we have seen already in many countries around the world.
Figure 2

[1] The ‘day ahead’ price of electricity is the auction price agreed between suppliers and purchasers of electricity for power to be delivered the following day. I couldn’t find an accurate figure but the estimates I came across suggested this market represents about 20% of all wholesale electricity transactions.
[2] I use the word ‘renewables’ in this note to refer to wind and solar output and do not include hydro or biomass or other low carbon sources of electricity.
[3] The equation for the trendline is shown on each chart. Please contact me for any other details you want.