Response from Professor Gordon Hughes to previous posting

(Professor Hughes has very kindly provided a response to a recent posting on this site. (Electricity output figures show wind turbine performance deteriorates very slowly with age). The original article was also carried on other web sites and Professor Hughes refers to the title and date of publication on the Ecologist blog. My reply to Professor Hughes is carried as a comment below his text.)  

Wind Turbine Performance Over Time: A Response to Chris Goodall


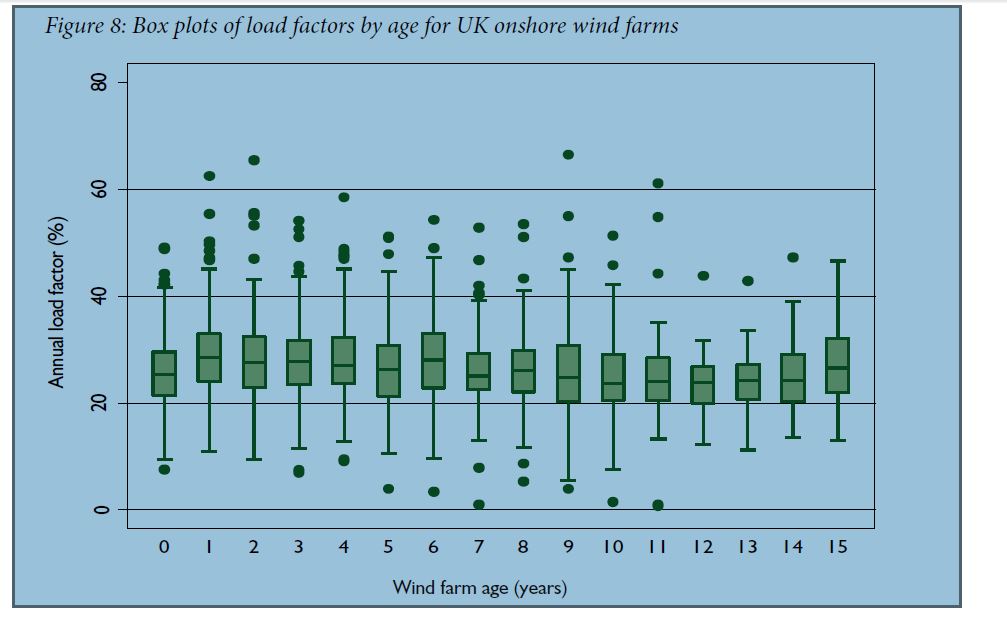
In his blog published on 03.01.14, “Wind turbines – Going strong 20 years on”,[1] Chris Goodall argues that the degradation in the performance of wind turbines with age is much lower than reported in my 2012 study The Performance of Wind Turbines in the United Kingdom and Denmark.[2] The following note explains why I believe that my conclusions are sound.

Mr Goodall has kindly provided me with the data to which he refers to in his work. With the exception of a long series for Delabole wind farm, Mr Goodall’s data is a small subset of the much larger sample of wind farms, several hundred in fact, analysed in my original study. Mr Goodall’s data also adds a few monthly observations that were missing when my data was originally extracted from the source database. Overall, Mr Goodall’s data amount to about 5% of the data that I analysed, and where he has new material it adds very little.

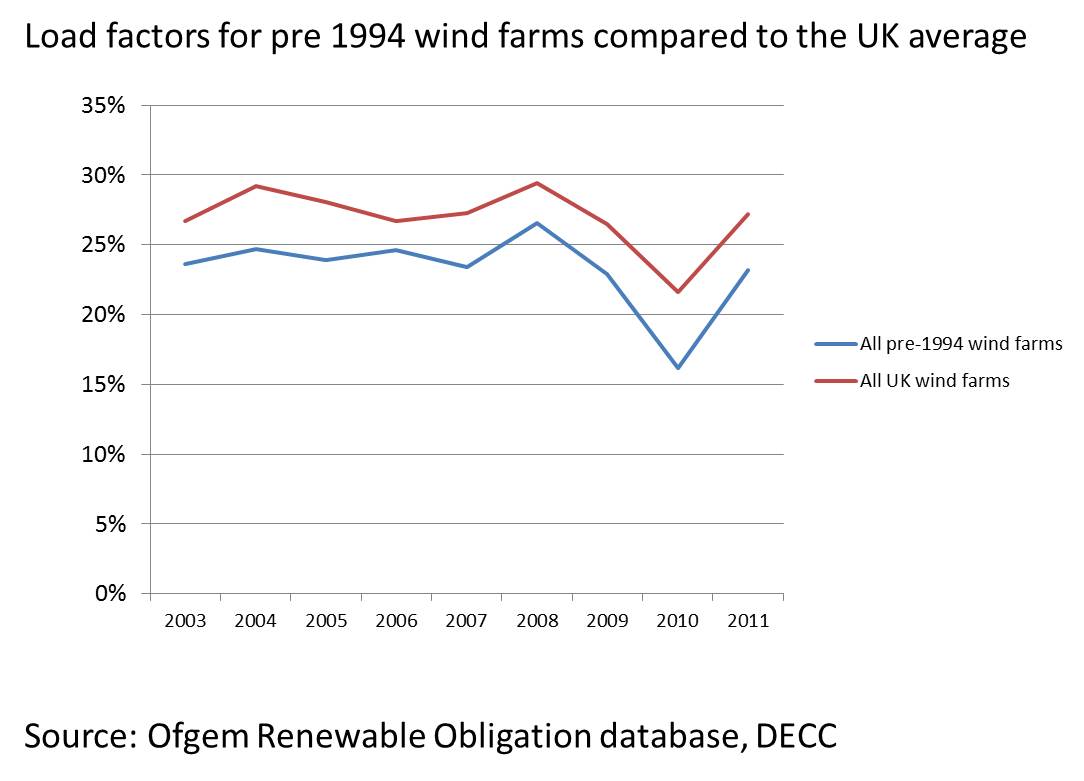
Furthermore, Mr Goodall himself very frankly admits that he does not have the statistical skills required to replicate the methods of my analysis. His work does not constitute a reanalysis or a rebuttal of my paper. In fact, his calculations simply reproduce one feature of the results reported in my paper.  There was a generation of wind farms developed in the early 1990s, both in Denmark and the UK, using turbines of less than 0.5 MW which have experienced a relatively limited decline in performance with age.  By focusing exclusively on these wind farms, Mr Goodall misses the bigger picture.  The performance of wind farms developed from the mid-1990s onward is much worse.  The average size of the turbines and the wind farms increased.  The larger turbines appear to have been less reliable, while my analysis suggests that the siting and maintenance of wind farms may have deteriorated.

Mr Goodall concludes with two challenges/questions which are representative of many comments on my work.  They spring from a lack of understanding of the statistical reasoning involved.  I will begin with his second question, since it is central to the analysis. Mr Goodall wonders how it is possible to estimate the decline of load factors over time when we have less than twenty years of data for any wind farm. This is where the mathematical/statistical specification described in the Appendix to my paper is crucial.

The load factor for any wind farm in any period is expressed as the sum (or product in the multiplicative version) of components associated with the age of the wind farm (held constant over all wind farms of the same age), the period (constant over all wind farms in one period), the site of the wind farm (constant over time and age), and a random error. This is a standard formulation used by statisticians, including for the analysis of data from a wide range of medical and biological trials. The age effects can be identified from the variation in output across wind farms of different ages for each month. So long as each wind farm is tracked for a number of periods, the site characteristics of the wind farm can be separated from age effects which are common to all wind farms of the same age.

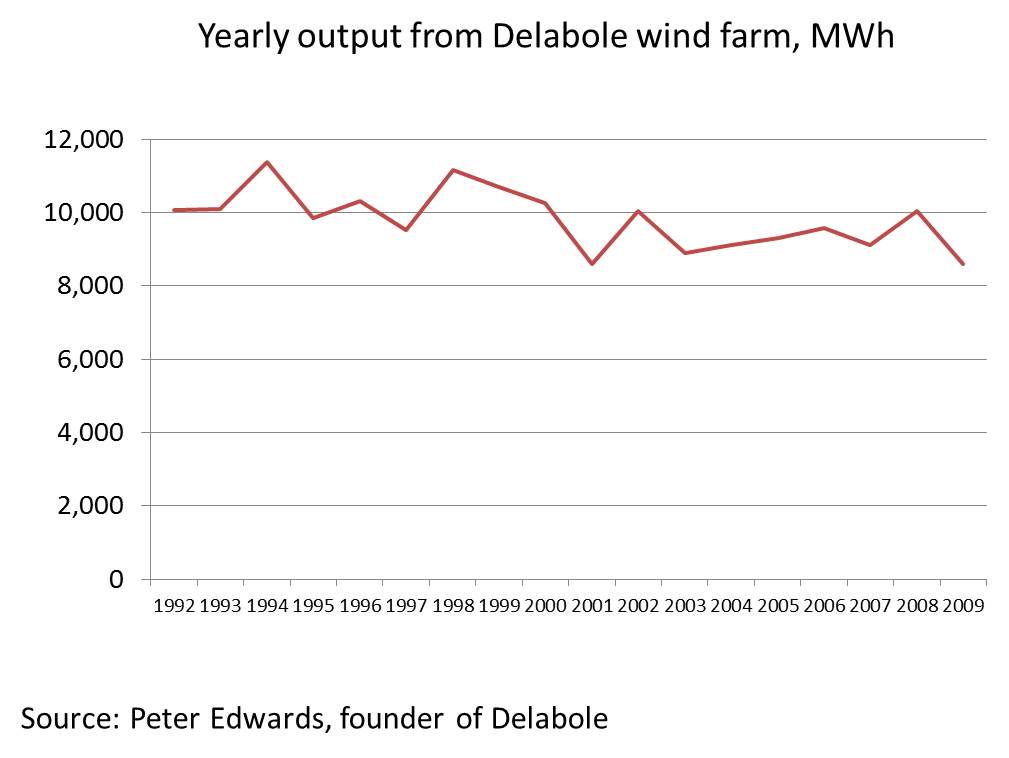
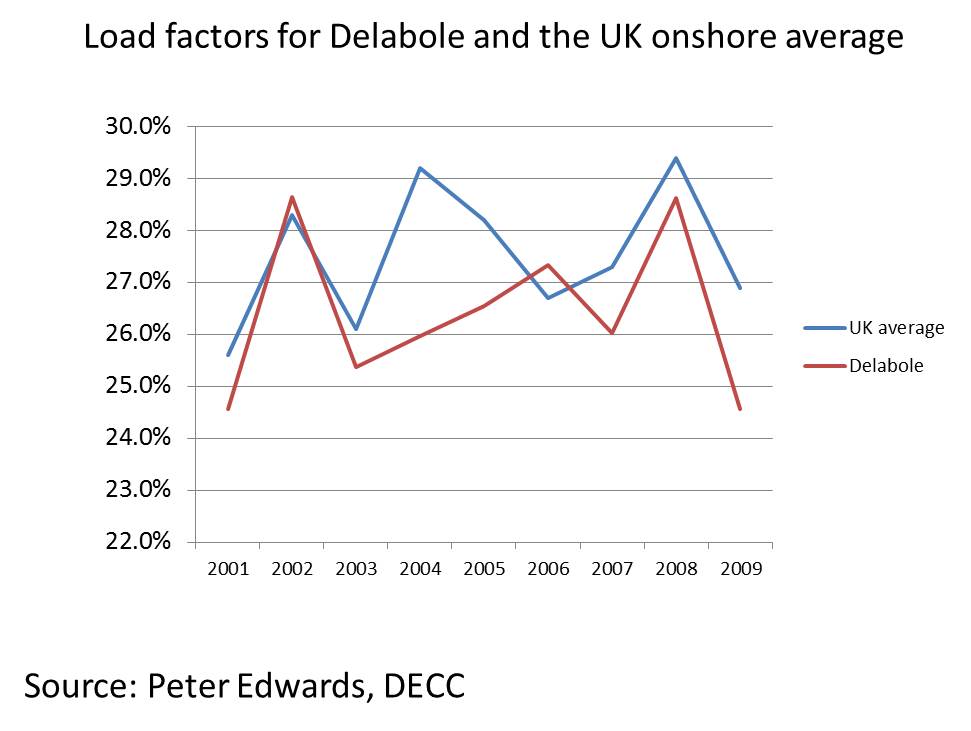
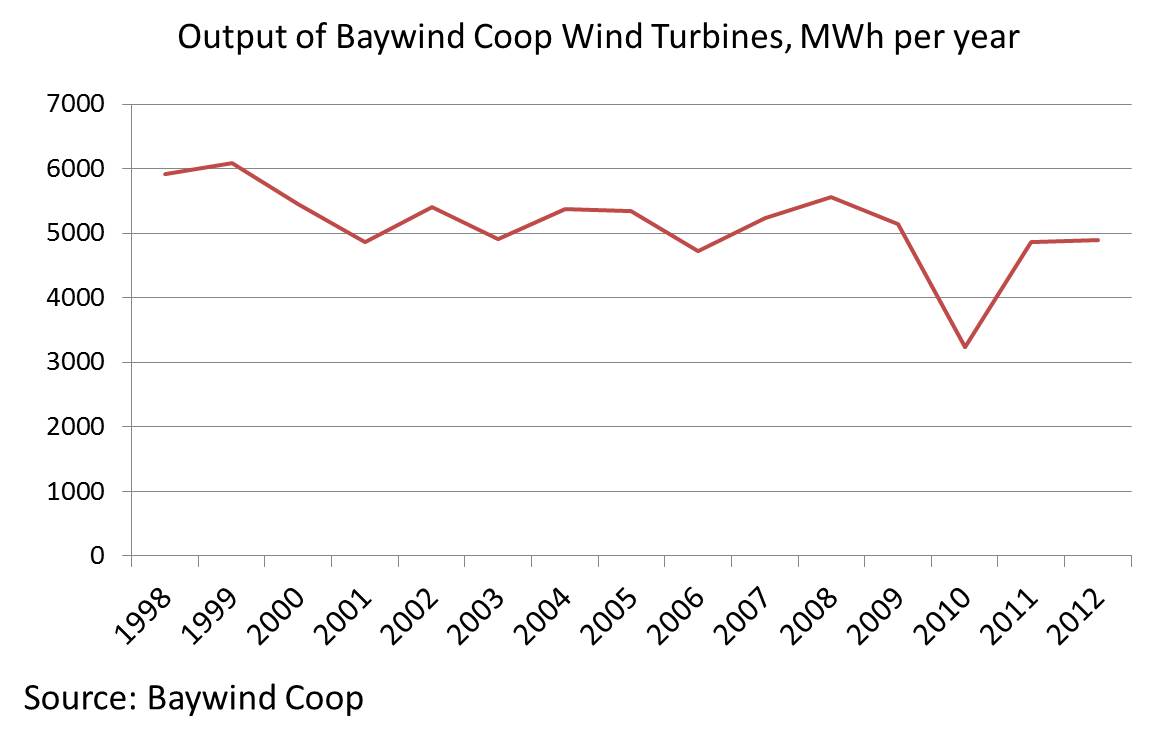
In his first question, Mr Goodall challenges me to produce a counter-example to the case of Delabole, which he claims demonstrates a much lower rate of degradation with age than that reported in my paper (in fact it is similar to the overall rate I report for Denmark). This is a recurrent theme among critics of my work. As an argument it is equivalent to someone claiming that smoking cannot harm anyone’s health because their “Uncle Jack” has smoked a pack a day for 60 years and is still fit and well at an age of 80. Of course there are apparent counter examples, and these can be found in the REF load factor database: www.ref.org.uk. It would be invidious to name them, and in any case they no more prove my analysis than Delabole disproves it. Individual cases prove nothing about population epidemiology, a point which is as true for wind power as for public health. The proof is in the statistical analysis itself.

As a separate point, I am struck by how selectively critics report the results of my work. As noted above, the experience of Delabole and other wind farms built in the period 1991-93 is consistent with my analysis of wind farms in Denmark, where load factors seem to decline more gently with age. That may reflect the robustness of wind turbines built in the early 1990s, site choice, how they have been maintained, and other factors. For the avoidance of doubt, I do not argue that the performance of wind farms must, inevitably, degrade rapidly with time. My observation is that the average performance of wind farms in the UK has, as a matter of fact, fallen as they have aged, a fact that is probably the result of both the physical characteristics of wind power and the economic characteristics of the financial incentive regime, the Renewables Obligation subsidy.

My results have important and obvious implications for both investors and policymakers. But the response of advocates of wind power is rather interesting. For the most part, it has involved an attempt to shoot the messenger rather than trying to understand the underlying phenomena. Yet, none of the statistical analyses of my or other data have demonstrated that there is no degradation in performance in age. The issue is not whether degradation occurs, but how much. There can be reasonable disagreement about that, as the comparison between Denmark and the UK illustrates (which is why I included that in my original study). The key point is to identify the causes of changes in load factors over time revealed by statistical analysis, and whether and how these may be addressed.

The willingness of the owner/operator of Delabole to provide unpublished data on output from the wind farm is to be commended, but, though welcome, it is only a small step in the right direction. Any investigation in this area is hampered by the unwillingness of operators to provide the wind speed data collected by the anemometers which are installed at all wind farms. Let me briefly indicate why this matters. One explanation for performance degradation over time would be an increasing frequency (or length) of mechanical failures of turbines. An alternative explanation is that the power curve (the relationship between wind speed and power output) changes due to gradual erosion of the blades, a phenomenon well known in the industry. An assessment of the relative contribution of these – and other – factors can be used to improve both turbine designs and maintenance regimes for existing wind farms, but such work cannot happen until the anemometry data from individual wind farms is made publicly available.

An ostrich-like approach of denying that there is a problem helps no-one. A lack of transparency leads to the suspicion that wind operators are unwilling to be accountable for the large sums of public money which they are currently receiving, and certainly makes it difficult to ensure that subsidy policies give good value for money to the consumers who foot the bill. But even the wind industry does not benefit in the long run, because it is foregoing the opportunity to learn from and build on the lessons from detailed analysis of performance.

Gordon Hughes

05.01.14

About the Author

Dr Gordon Hughes is a Professor of Economics at the University of Edinburgh, where he teaches courses in the Economics of Natural Resources and Public Economics. He was senior adviser on energy and environmental policy at the World Bank until 2001.


[1]http://www.theecologist.org/blogs_and_comments/commentators/2221532/wind_turbines_going_strong_20_years_on.html

[2] Gordon Hughes, The Performance of Wind Turbines in the United Kingdom and Denmark (Renewable Energy Foundation: London, 2012). Available for download at www.ref.org.uk.

Electricity output figures show wind turbine performance deteriorates very slowly with age

I wrote a few weeks ago about the surprising assertion from the Renewable Energy Foundation (REF) that the performance of wind farms declines rapidly with age. A study carried out by Professor Gordon Hughes for the REF in 2012 suggested that ‘The normalised load factor for UK onshore wind farms declines from a peak of about 24% at age 1 to 15% at age 10 and 11% at age 15’. To put this in everyday English, Professor Hughes is saying that a 15 year old onshore wind farm will typically produce less than half its initial output of electricity. Few people in the industry would demur from a conclusion that wind farms very gradually lose output but none accepted Hughes’s finding that electricity generation falls at anything like the rate he stated. If true, his finding would have serious implications, as the REF was keen to point out. To achieve the UK’s targets for wind-generated electricity, we would have to put more turbines on the ground because ageing wind farms would produce much less power than expected. This is an important topic and I thought it needed more examination.

After meeting REF in early 2013, DECC Chief Scientist David MacKay responded to the study, eventually publicly saying that Hughes’ work had serious statistical flaws. REF has recently rebutted Professor MacKay’s comments saying, with some asperity, that his actions are ‘extraordinary’ and impugning his understanding of econometrics.

Few of us have the detailed knowledge of statistics to say whether Hughes’ conclusions follow from the data he has used. I thought it might therefore be helpful if I analysed the individual performance of all the UK’s oldest wind farms. I’ve looked at the data on the output of 14 farms, all established in the period 1991 to 1993. I’ve been particularly helped by the assistance of Peter Edwards, the entrepreneur behind Delabole, the Cornish wind farm that started the UK’s commercial exploitation of wind for the purpose of generating electricity in December 1991.

Hughes’ study contained no assessment of the performance of specific wind farms. All the data was merged into one large statistical series. On the basis of my assessment of actual production data from the earliest farms – all but two of which are still operating with the initial turbines – I want to suggest that the empirical evidence strongly suggests that Professor Hughes greatly exaggerates the rate of performance decline. None of the 14 wind farms shows ageing effects more than a small fraction of the figures he quotes. Investors and the general public can be confident that performance degradation is not a large problem.

Method

I have two sources of data. First – with many thanks to Peter Edwards – I have the yearly output figures from Delabole from 1992 until the farm was ‘repowered’ with new, much larger, turbines in mid 2010 after nearly twenty years of production.

Second, I have the numbers from Ofgem’s database on the output of renewable generators. These numbers only go back to April 2002. (I have no idea how Professor Hughes could possibly have calculated the rates of decline of electricity output of twenty year old turbines when – at most – he only had ten years of figures).

We also have information on the average performance of UK onshore commercial wind turbines. DECC publishes a yearly estimate of the ‘load factor’ of existing wind farms. (The ‘load factor’ is the percentage of maximum yearly output actually achieved). Load factors vary – principally in response to average wind speeds. Professor Hughes’ work suggests that after accounting for wind speed variations load factors fall every year from the moment a new turbine is installed. This is what I wanted to check using real world data.

Delabole

Chart 1 shows the yearly output from this Cornish wind farm from 1992 to 2009. (The repowering process started in mid 2010 so later output figures are not available).

Peter Edwards commented to me that the reason the 2009 figures appear to show a drop is that the operators of the wind farm (by then it was the utility Good Energy) decided it wasn’t worth replacing a gearbox because the turbines were scheduled to be taken down in less than a year’s time.

But even with the lower level of output in 2009, the average yearly decline was only  about 0.8% of output, not the 5% estimated by Professor Hughes. [1]2009 electricity production from turbines that were then 18 years old was 85% of the first year’s figure. In 2008 – when the turbines were still being actively repaired – Delabole recorded electricity generation of 99.6% of its initial annual output. Rather than output being more than halved, performance had fallen by a few megawatt hours a year.

Chart 1

Delabole 1

I don’t have UK average ‘load factors’ before 2001. Chart 2 shows how Delabole compared to the typical onshore wind farm in the years between 2001 and 2009. On average it was slightly lower, with a more marked difference in 2009 because of the lack of repairs to gearboxes. But the differences are small and there certainly isn’t any obvious sign that the performance was degrading against the UK average.

Chart 2

Delabole load factors


The oldest UK wind farms

If Hughes is right, then the oldest turbines should be very much less productive than the average UK figures. Of course wind farms established in the early 1990s might have been placed in particularly wind locations which might push their outputs upward. Balancing this, newer wind turbines could be expected to be better designed, and able to turn more of the energy from wind into useful electricity.

Chart 3 shows that the 14 oldest wind farms have load factors slightly below the UK average for the years 2001 to 2011. But there is no evidence of any widening of the differences. And, most importantly, the absolute level of output of these geriatric turbines is very much higher than Professor Hughes said. He wrote that turbines in their fifteenth year of operation should typically produce 11% load factors. In fact, these elderly wind farms – all of which were over eighteen years old in 2011 –  had average load factors of well over twice Hughes’ predicted output. They seem to have suffered more than expected in the historically highly unusual low wind speed year of 2010. (I suspect this is a consequence of better engineering for low air flows in newer turbine designs). But otherwise performance shows no relative decline from a decade ago.

Chart 3

load factors for pre 1994 and all wind farms


One last request. Anybody in active communication with Professor Hughes might want to ask him two questions. First, can he show us any individual wind farms that demonstrate the rate of deterioration his forecasts suggest? There were about 380 onshore wind farms recorded in 2012. The oldest 14 show nothing like the signs of ageing that Hughes grimly forecasts. Do any others? Are there any examples of farms whose wind-speed adjusted output has actually fallen 5% a year as he predicts?

Second, given that the outputs from wind farms are only publicly available from 2002, how is the Professor able to estimate exactly what the rate of decline in output of a twenty year wind farm is likely to have been? Because of Peter Edwards’ generosity in releasing Delabole figures to me, I can show that the decline of that single farm’s output is nothing like Hughes’s statistical forecasts. How did the Professor get to his numbers when he only had – at most – ten year’s data available for all the rest of the UK’s fleet of turbines?


(Please write to me if you are interested in seeing the data I used).


[1] This is estimated using simple linear regression.

[2] These calculations exclude Delabole and Goonhilly wind farms for the years after mid 2010, when both were repowered with new turbines. The other farms have unchanged configurations. The load factor I have used for the UK as a whole is also on an 'unchanged configuration' basis.

Air travel forecasts have been cut by 35% in the last six years. Why do we believe today's numbers?

In the last six years the government has produced four different forecasts for air passenger numbers. Each successive estimate has been substantially lower than the last. In January of this year the Department of Transport published an estimate of 315m passengers in 2030 compared to a figure of 480m in November 2007, just fifty months earlier. As the UK starts a new round of animated discussion about expanding Heathrow we might bear in mind that forecasts for air travel have been consistently too high in recent years, even for the immediate future. 2009 estimates about travel numbers in the following year were over 15% too high.

Today's report from Howard Davies' Airport Commission proudly boasts that its forecasts - which are broadly the same as those of the 2013 Department for Transport figures - have a far lower margin of error than all previous estimates. (Please see figure 4.3 in the Davies report). They are more certain than ever of the accuracy of their central forecast. In the face of the huge and completely unpredicted reduction in forecast demand for aviation over the last six years, isn't about time that we considered the possibility that the need for aviation has begun to stagnate?

(Past articles on the troubled logic behind Heathrow expansion plans are here, here and here.)

Whether or not the UK needs new runways depends almost exclusively on future demand for air travel. The five decades between 1950 and 2000 saw typical growth of nearly five per cent a year. However 2012 passenger numbers were no higher than in 2005. Is this effect of economic difficulties around the world or does it represent a clear sign of a maturing market? The Department for Transport thinks growth will return once economic difficulties are behind the UK. But it has nevertheless sharply cut its forecasts since 2007. This year’s estimates are a third lower than those provided just fifty months ago. Travel numbers are expected to be permanently lower than they were.

Forecasts of number of passengers using UK airports, millions per year

 Air travel forecasts

Source: Department for Transport forecasts

Are the new lower forecasts likely to be accurate? Or have we reached peak air travel in the same way as we are experiencing a plateau in the needs for surface transport? The latest estimate suggests a 40% rise in air travel in the next seventeen years, an increase of over 2% a year. As real incomes continue to fall, I think the Department for Transport is probably still being too bullish. Basing the case for a third runway at Heathrow on forecasting techniques that have proved spectacularly wrong in the last half decade looks a little foolish to me.


Another nail in the coffin of econometrics: Gordon Hughes and the abuse of statistics

It was the proud boast of an econometrician I knew that he could ‘prove’ anything using statistics. He would have loved Gordon Hughes’ 2012 paper on the effect of age on the output of wind turbines. Hughes produced figures suggesting that the typical electricity generation of a UK onshore turbine falls sharply ever year of its life. He says the average load factor of a new wind farm starts at about 25% and is down to below 5% within scarcely more than a decade. Econometrician Hughes never seemed to talk to any operators of wind farms, who would have corrected his wild statistics. Nor did his paper actually provide us with the output figures from any individual turbines. Nevertheless, this didn’t stop his extraordinary analysis from getting substantial coverage. Yesterday Professor David MacKay, chief scientist at DECC, weighed in against Hughes’ conclusions. For those whose eyes start going round in circles when faced with equations like those in MacKay’s short article, let me provide one chart from Hughes’ paper which might help convince you that wind turbines don’t actually age faster than domestic cats.

In this chart, taken directly from the paper, Professor Hughes plots the average ‘capacity factor’ of turbines split by the age of the wind farm. (The ‘capacity factor’ is the percentage of the maximum output of a wind farm actually achieved in any year. For the UK onshore wind industry as a whole, capacity factor hover around 25-30%, depending on the strength of the winds in the year.)

Hughes

The centre line in the middle of the green box is the average for the turbines of that age. The length of the box reflects the degree of variation between the wind farms in that group. You’ll notice that the average capacity factor doesn't actually fall as the age of each cohort of turbines increases. 15 year old wind farms do as well as farms in their first year. This inconvenient data didn’t stop Hughes. He went into overdrive to show that old turbines fall apart. And there’s always a statistical technique to enable you to do this. And very few people like David MacKay able to say quite how inappropriate that technique is.

Just so you can be sure that Hughes’ conclusion that onshore wind turbines lose 85% of their power in fifteen years, here are the generation figures from the Baywind Cooperative in Cumbria. Yes, the first full year produced more electricity than last year, but 1998 and 1999 were year of some of the highest wind speeds in the last two decades. By contrast, 2010 had probably the lowest wind speeds since the second World War. Take out these data points and you’d be hard pressed to show any decrease in output.

baywind 3

Wind turbines probably do deteriorate over time. They are very complicated mechanical devices undergoing huge mechanical stresses. But the decline is small, fairly predictable and nothing like as sharp as Professor Hughes says. Hughes' work demeans his profession.


Government cuts its projections for offshore wind

The unrecognised implication of today’s announcement about the strike prices for low-carbon technologies is that the government has cut its ambition for the size of the UK offshore wind industry in 2020. A month ago it said that its delivery plan ‘indicated deployment of up to 16 gigawatts by 2020’. Today (4th December 2013) it says that ‘DECC modelling suggests that 10 gigawatts is achievable’ (My italics). It then backs off further, stating that the 10 GW figure ‘is not a target’ and that ‘actual deployment will depend on technology costs’. Perhaps as importantly, the government is now talking – albeit in very abstruse language – of reducing the strike prices of ‘mature technologies’ if and when they become too successful. In other words, the strike prices published today for PV and onshore wind are far from guaranteed. If, as I expect, developers put far more PV farms on the ground than DECC is forecasting, the prices paid will be reduced.

In their analysis of the strike prices, the media focused on the changes made since the draft figures were published in July 2013. Much was made of the increased price for offshore wind. This emphasis was wrong.

Strike prices for offshore wind/MWh

2014/15 2015/16 2016/17 2017/18 2018/19
Draft proposals £155 £155 £150 £140 £135
Decision £155 £155 £150 £140 £140
Difference £0 £0 £0 £0 +£5


Despite what the government wanted us to believe, this wasn’t the key difference  between July and now. Nor were the small, and unsurprising, reductions in subsidy for solar and onshore wind, and quite sharp cuts in landfill and sewage gas payments the critical new developments.

The real change is the major reduction in the degree of commitment to building a very large offshore wind industry. In the July draft document, offshore wind was ‘projected’ to reach 8 to 16 gigawatts by 2020. The July document goes on to say that ‘the upper end of this range is reached if costs come down to meet industry aspirations and there is some delay to nuclear and CCS’ (which there has been - no nuclear station will be built before 2023 at the earliest).  In November, the language was firmed up and ‘deployment of up to 16 GW by 2020’ was indicated in DECC’s published roadmap.

Today, we’re told that ’10 GW is achievable’, not ‘projected’ as it was earlier in the year. As a consequence, the target for the share of renewables in electricity generation is also softened. The final strike prices provide ‘a basis for renewable electricity to achieve at least 30% of generation by 2020’ DECC said. By contrast, the July projections told us that low carbon generation would actually represent 30-35% of all sources of electricity by 2020, not that it provided ‘a basis’ for achieving this target.

The other big change is in the language on ‘competition’. What DECC means by this is that if technologies start to look as if they will be too successful (and therefore absorb too much subsidy), then the government will conduct reverse auctions to drive down the strike price. The installations requiring the lowest prices will get the available pot of subsidy. This may well be a good idea but it is an idea entirely lacking from the July consultation. Of course the risk is that the benefit of a secure strike price – principally that it gives investors the confidence to spend millions in planning large wind or PV installations – will disappear if the price can actually change overnight.


A modest proposal to give away LED lights

I want to open discussion of a small and eccentric scheme to reduce emissions and household bills while slightly improving the UK’s energy security. My suggestion is that the UK gives every householder a voucher for 10 high efficiency LED lightbulbs. LEDs are now better, more long-lasting providers of light than traditional compact fluorescent bulbs and halogen spotlights. They are still expensive and takeup is quite slow. The payback for the average bulb is probably about four years and for most people this is too long. Free vouchers will change this. Giving every householder ten free bulbs would reduce bills by at least £20 a year and for some people much more. It would cut UK emissions by about half a percent and, importantly, should shave peak electricity demand by at least double this percentage.  I calculate the cost to be about £1.6bn, or slightly more than the much- disliked ECO scheme.

It could be restricted to those in fuel poverty, reducing the cost to a fraction of this amount.  The cost per tonne of carbon saved is approximately equivalent to other measures. The scheme is progressive because the benefits can be directed mostly to less well-off people.LED bulbs

In the last year, LEDs have come of age. The newest lamps now give the same quality of light as halogens and the old incandescent bulbs. They fire up immediately, unlike many compact fluorescents (CFLs). They last many tens of thousands of hours, or several years in continuous operation. They can be retrofitted in existing 12v and mains lamp fittings.

Although the price is coming down, they are still expensive. As a result, the big retailers still give LEDs relatively little space and don’t promote them heavily.

The most competitive online retailers are offering 12v halogen replacements at around £6 from unbranded suppliers. The products of the best-known manufacturers are two or three times as much.

A 7w LED can provide approximately as much light as a 35w halogen, a five to one improvement. All our lights will be LED at some point in the future. We need to accelerate the transition.

Electricity use in the home

In recent years the amount of electricity to use for lighting in the home has tended to fall. CFLs have reduced average energy used from about 700 kWh a household to around 500 kWh a year. This is still about a seventh of total residential demand.

Getting people to replace fridges or televisions with more energy-efficient models is difficult. Few people are going to trade in old, but functioning, washing machine because they might save £20 of electricity a year. Lights are different. The payback is much shorter and it is simple to take out one bulb and put in another.

There’s another reason for pushing this scheme. Lighting demand is at its peak just as the UK experiences its maximum electricity need at 5.15 on a December afternoon. The lights are still on in shops and offices and, in addition, most homes need lighting at this time. So quickening the slow process of switching to LEDs will help shave electricity demand, reducing the possibility of blackouts in future years. (When people speak of the ‘lights going out’, they refer to the possibility that the UK’s power generation capacity will not be able to meet this early evening weekday peak. There’s no possibility yet of more generalised power cuts at other times of the day.)

The cost

Giving 26 million homes a voucher for ten LEDs isn’t a trivial expense. But it is little more than the discredited ECO scheme and it will be much more effective. The voucher will be usable at any participating retailer (which might chose to take its wares door-to-door to offer customer a chance to pick the lights they want). I think retailers will be willing to accept £60 as the government payment for redeeming the voucher, or £6 a bulb. This implies a cost of about £1.6bn, perhaps spread over two fiscal years as ECO is.

The savings

I assume that the ten LEDs are all installed by the homeowner. The average light bulb in a high traffic location in the home is on for two hours a day. If we estimate that the ten LEDs are all in these locations and save an average of 25 watts, then the total yearly saving per household is about 150 kWh. The financial benefit is about £20 at today’s electricity prices, more in a home on Economy 7 tariffs.

The carbon saving is about 2 million tonnes a year, or 1/2% of the UK total.

We cannot accurately know how many of the bulbs will typically be in use when the early evening peak arrives. If this number is 50% of all the bulbs installed under this scheme, the likely saving is about half a gigawatt or just less than 1% of peak UK demand. This is about half the electricity provided by a large new gas-fired power station but, more importantly, it will make a significant improvement in the safety margin available to the National Grid.

The other changes that might spring from the scheme

Once householders have changed 10 bulbs successfully, they will be more likely to move on to convert their whole house. Then the savings might be three times as much. The example of the savings in domestic homes will tend to accelerate the remarkably slow switch to LEDs in shops and in commercial and public buildings.

A successful voucher scheme will make LEDs better known, increase retailer interest and encourage further innovation in design.

The impact on fuel poverty

Of course the impact of this scheme isn’t particularly significant. £20 for the average household is a small fraction of the total electricity bill. But for the poorest people, who are more likely to be at home all day, the savings could be larger. They tend to use fewer lights but to have them for longer. If we wanted to more precisely focus the scheme, it could be restricted to the same groups as the ECO is targeting – older people and households in the most deprived areas.

Even though the scale of this proposal is quite small, it would induce a much faster shift to LEDs than will otherwise occur. It can be targeted at people for whom cash is tight and therefore for whom a switch to LEDs is simply too expensive, even though the payback is only a few years.

The push to improve the energy efficiency of UK homes must go on. The last few weeks have shown how difficult it is to get insulations standards improved at a reasonable price. A switch to LEDs offers equivalent benefits and much, much easier implementation.


New UK wind power record and gas use falls commensurately

Another UK wind record was broken today. For the first time ever, total output of the major wind farms reached just over 6 gigawatts in the early afternoon. This was about 14% of the country’s total requirement for electricity, much less than it would have been if the storm had passed over the UK during the night. Nevertheless, today’s strong NW winds provided a fascinating little case history for us to look at. The flags on the flagpoles weren’t even fluttering in the daytime yesterday. Total output from wind turbines was little more than 5% of today’s figure. Wind speeds then strengthened consistently until early afternoon today. As expected, wind displaced gas in the electricity generation mix. The high level of wind output even resulted in small net exports to the rest of Europe.

Here’s what the pattern of supply looked like at 14.30 on the two adjacent days

Total electricity output at 14.30

Yesterday 44.6 gigawatts  
Today 44.3 gigawatts Down 2.3 gigawatts


The UK wind turbines that are not connected to the trunk of the electricity  grid aren’t recorded in the records of electricity generation. Instead they reduce the total amount of power needed from the big generators. Friday tends to have a lower electricity demand than Thursdays but today’s high wind speeds are probably responsible for almost all of the difference between yesterday and today.

Today, the large wind farms were generating 5.7 gigawatts more than yesterday at the same time.

Wind output at 14.30

Yesterday 0.4 gigawatts  
Today 6.1 gigawatts Up 5.7 gigawatts


Taken together, high winds today reduced the need for power by about 8 gigawatts. Unsurprisingly, gas output was down almost exactly this amount. Coal power was virtually unchanged.

Output from gas fired power stations at 14.30

Yesterday 19.5 gigawatts  
Today 11.2 gigawatts Down 8.3  gigawatts


And, it’s worth pointing out there were no incidences of the use of oil-fired or open cycle power stations during this 24 hour period.

When the wind blows, fossil fuel power stations simply work less. Wouldn't it be wonderful if the wind power sceptics took a look at the data rather than continuing to assert that fossil fuel power stations work as back-up even when the wind is at its strongest?

Did RWE really abandon a long-planned offshore wind farm because of 'deep water'?

atlantic arrayRWE is at pains to suggest that its withdrawal from the 1.2 GW, £4bn Atlantic Array was largely driven by unexpected technical difficulties. In the Financial Times, the company mentions the ‘deep water’ and ‘adverse seabed conditions’. We can be a little sceptical about whether this was the real reason: the company had been working on the Array since 2008 and submitted a full planning application almost five months ago. It seems implausible that a major European utility had devoted years of effort to the project only to find in late 2013 that the water was quite deep in the Bristol Channel. We need to look behind the pretence and work out what might be actually happening. Perhaps when they said 'deep water' they had a metaphorical meaning in mind. I think RWE’s shift may be more to do with its increasingly perilous financial position and its recent change in corporate strategy. The Germany Energy Transition is marginalising RWE and the other large utilities as increasing levels of PV penetration devastate wholesale electricity prices. RWE is far less profitable than it was and is no longer able to raise the almost unlimited levels of capital necessary to finance the expensive shift away from fossil fuels. As a result, the company intends to make a transition from being the owner of capital-intensive power generation capacity and will move towards such activities as the provision of services for the ‘smart grid’. The consequences for the UK are serious: if the major German players (E.ON and RWE) in the UK electricity industry are unable or unwilling to finance investment in nuclear, wind or solar, who will do it?

RWE’s problem

In the UK, we complain about the ‘excess profits’ of the large utilities. Investors in German power companies must utter a hollow laugh when they see these comments. RWE has just changed its guidance to the German stock market. Profits for the entire company, operating in several markets beyond its own national border, are projected to fall from €2.4bn in 2013 to about €1.4bn in 2014. Fossil fuel power generation returns are expected to decline to below zero by 2020. Partly as a result, Germany’s main business newspaper called it ‘a dinosaur on the brink’ yesterday.

Contrast the experience of the UK’s SSE, the nearest local equivalent to RWE. Its share price (green line)  is up 20% in the last five years compared to RWE’s 60% decline.

Share price chart

RWE SSE

What’s driving RWE away from profitability? Germany’s energy transition away from fossil fuels has left the old companies with stranded assets. Some sources suggest that almost half the country’s fossil fuel plants no longer make any money. And why is this? The devasting effect on wholesale power prices of wind and solar power.

This can be summarised in one chart: RWE’s own figures for electricity prices in the forward markets. Chart 2 shows the graphs contained in the company’s summary of business conditions at the end of the third quarter. The wholesale price of electricity in 2014 has slipped to less than €40 a MWh, down from nearly €60 two years ago. Every megawatt hour RWE generates is worth a third less than it was. Few companies could hope to survive this price crash.

Chart 2German wholesale


The UK Big 6 say rising wholesale costs mean that the retail price to UK households has to rise. In Germany, things are very different indeed. The market is now acutely vulnerable to the weather. Wholesale power prices fell to an average of less than €30 a MWh in the windy last week of October 2013 and dipped to below zero for several hours. This happens increasingly frequently.

Any large investor will look at Germany and assume that other countries will go through the same change. Subsidised renewables that produce power at zero marginal cost [1] increasingly dominate the local grids. Investing in electricity generation is becoming no job for cautious fund managers in Europe or anywhere else. Unsurprisingly, over 99% of new electricity capacity installed in the US in October was low-carbon.

Without profits from fossil generation, RWE doesn’t have the cash to invest in huge new wind farms off the Devon coast. Contrast the £4bn price tag for the Atlantic Array (which would generate about 1% of the UK’s electricity needs) with RWE’s expected worldwide profits of about €1.4bn next year. In addition to low cash flow, RWE also suffers from high financing costs. It complains that its investors demand much higher returns than are available on most renewable projects. Pension funds and insurance companies are better suited to investing in solar parks and wind farms. Not surprisingly, RWE itself has divested a substantial fraction of UK renewable capacity to special purposed vehicles set up to purchase existing wind farms.

RWE’s still secret but much discussed new strategy is a reaction to its problems of capital shortage and poor profits. A board document called RWE Corporate Story suggests that the company will move away from ownership of assets to what it calls a ‘capital-light’ approach. It will operate and maintain electricity generating plant but not own the expensive offshore wind turbines or anaerobic digestion plants that European countries are turning to. It will offer services such as supply/demand balancing to the operators of electricity distribution grids. Commentators have noted the resemblance to the evolution of the telecoms or mainframe computing industries twenty years ago. IBM used to be the world’s largest manufacturer of computers but it shifted rapidly into software and service businesses.

Other large utilities have suggested they will take a similar path. NRG, an important US power generator, openly forecasts that the electricity market will evolve rapidly towards more local and independently owner generation. Major utilities, whose business has changed less in the last fifty years than almost any other type of company, will be forced to switch strategy at an unprecedented rate, particularly in light of the falling costs of solar PV farms. David Crane, the CEO of NRG and an unusually frank commentator, says that US consumers are realising that ‘they don’t need the power industry at all’. Decentralised, small-scale wind and solar installations can supply all their needs when adequately backed up with storage or small gas-fired generators.

One final factor may have influenced RWE’s upsetting retreat from the Atlantic Array. In the company’s home country, offshore wind is becoming a nightmare for politicians. The transition to 100% renewables that Germany intends to make depends on putting a huge number of offshore turbines into the Baltic and North Sea. The country is waking up to the cost. A feed-in tariff of 19 Euro cents per kWh now looks increasingly unaffordable and the tortuous coalition negotiations between the two largest German parties are focusing on this number. Chancellor Merkel herself said that offshore wind subsidies needed to be concentrated on only the best offshore locations.

RWE must have felt that the same political debate is likely to happen in the UK where the proposed subsidy for offshore wind is also far higher than alternative low-carbon technologies.  Indeed, a close reading of its press release this morning will demonstrate that it actually blames ‘market conditions’ as frequently as ‘deep water’ for its withdrawal from this vital project. (Readers from outside the UK may need to know that ‘market conditions’ in the energy market is a euphemism for ‘political commitment to high levels of subsidy’).

Here’s the problem in a nutshell: the UK and other countries need rich and large utilities to fund the energy transition (and I include nuclear, of course) but every step taken towards that goal tends to emasculate the power of the big existing players and reduce their ability to raise capital. As the dinosaur RWE advances towards the brink, who will step forward to put £4bn into a large wind farm? Many will respond by saying that we should switch instead to backing small scale and local energy production. Fine, I say: 3,000 of EWT’s excellent 500 kW onshore wind turbines would replace the power of the Atlantic Array. But where is the capital, the regulatory structure and political support necessary to get those windmills up within the next five years. I don’t see it yet.

(With many thanks to Gage Williams, who may not agree with my conclusions, for pointing me to the RWE and NRG documents).


[1] I apologise for the slightly technical language. The ‘marginal’ cost of something is the extra money a producer has to pay to create one extra unit of output. A gas-fired power station has to be pay for gas and wear and tear when it produces one more kilowatt hour of electricity. By contrast, an extra unit of power from a PV farm costs nothing.

How not to generate low carbon innovation: DECC's flawed choices for energy storage.

Terrajoule (Simon Daniel of Mioxa - one of the winners of the DECC competition and a company whose understanding of USB technologies I have always much admired  - sent me some notes and has kindly allowed me to use them as a comment at the end of this article).

(Second update: John Samuel of REDT, the owner winner, has also contributed comments below the article. See the post at 10.44 on Monday 11th November)

Storing low carbon energy is the most difficult technical challenge we face. Fossil fuel power stations can cheaply vary their output as demand changes. Neither nuclear power nor renewables have the same flexibility. Nuclear plants are so expensive that it makes no sense at all not to run them all day and every day. Renewable technologies generally either suffer from unpredictable variability (wind, solar in high latitudes) or from predictable variations (tidal range and tidal stream). Matching supply with demand is increasingly difficult. Unless we solve the storage problem, we’re facing a future of unplanned power shortages and gluts.

The British government’s response to the storage challenge was to launch a competition to reward promising technologies. We need huge innovations, imaginative leaps and investment in new ideas. What we got from DECC this week was unexpectedly small amounts of money dribbled to two battery companies with standard technologies. There’s nothing particularly wrong with the winning projects: it’s just that they are very small scale and the batteries can never hope to address the huge need for long term storage of energy.

This is so disappointing. When will government understand that handing relatively small amounts of cash to companies – however competently run -  that offer marginal improvements on existing technologies actually damages the rate of progress by diverting intellectual energy away from genuine innovation?

Rather than just rail about DECC’s short-sightedness, I thought I’d also briefly write about another company that has just obtained a new round of venture finance. This may be a good way of demonstrating just how mindlessly conventional the UK has been. Contrast Terrajoule in California, with its potentially cheap, resilient and quite low-tech solution that offers local storage using pressurised steam, and the two UK companies sponsored by DECC.

The DECC competition

Gigha

DECC said it had £17m available for innovative storage projects. In the end it seems to have given away about £5m of this fund. The majority of the money has gone to the provision of a 1.2 MWh battery on the small Hebridean island of Gigha.

Gigha is a fascinating place; entirely community owned and with its own three turbine wind farm (about 600 kW in total). The total annual production from the wind farm is about 2.1 GWh and most of this is exported. (As far as I can tell, the island has about 100 people living on it and they probably would probably us less than 10% the output of the turbines). Expanding wind generation is difficult because of what is called the ‘ageing’ cable taking power to the mainland a few miles away.

gigha

Eventually places like Gigha will want to be almost separate from the wider electricity grid, generating their own power and selling it to the local population. This requires storage of the electricity generated by the high winds coming off the Atlantic. The DECC award is for a 1.26 MWh vanadium redox battery, storing approximately 0.06% of the island’s annual wind production. (1.26 MWh is approximately a third of one household’s annual electricity use).

Of course these numbers aren’t really fair. The advantage of a battery is that is can cycle from flat to full many times in one year. Most batteries deteriorate a little every time this cycle happens but vanadium redox is capable, its proponents claim, of almost indefinite use. But when it blows hard on Gigha, it can blow for several days and the battery will be full almost all of the time during winter. It’s unclear to me quite how useful this will be. Clearly the most interesting application of the battery its potential for replacing grid electricity in the event of a malfunction of the cable but it’s not clear from the press releases whether it will actually operate as an emergency power supply.

The cost is high. £3.6m for 1.2 MWh of storage is £3,000 a kilowatt hour, over three times the price of the equivalent cost of a new battery for an electric car. It may not be an appropriate comparison but Gigha is also planning a fourth wind turbine at a cost of about £3,000 a kilowatt. This turbine will probably produce 1,200 kWh per kilowatt per year and the battery will only ever be able to store four hours of the peak output of this extra turbine. The disparity between storage costs and generation costs is dispiriting.

Moixa

The second project is smaller. The battery company Moixa is being given about a million and a half pounds to install domestic electricity stores in about 750 homes. The idea is that rooftop PV power is usually exported from the home in the middle of the day and it makes sense to store it for use at night. And, second, that electricity will eventually be much cheaper for all customers in the middle of the night than in the early evening when power demand is highest. So the battery can also be charged during the night and the electricity used at other times. The battery will produce DC power and the homeowner will install a second circuit to deliver electricity to such things as low voltage LED lights or rechargeable home devices including tablets and mobile phones.

Balancing-the-Grid_732x328_hq

The Moixa product, which already in test, stores 1 kWh. The Maslow is priced at around £1,250, or about 40% of the cost of the Gigha vanadium redox battery per unit of storage. 1 kWh is 10% of the average home’s daily electricity use. A home with a 3 kW PV installation on the roof will (very roughly) generate about 15 kilowatt hours a day during the high summer and 3 kWh during the winter. The Moixa battery will therefore store a relatively small fraction of total electricity generation.

The second problem is slightly complicated to explain. During the summer, the stored DC power will probably not be used. The householder probably won’t need the LED lights (because the sun is above the horizon in the UK for sixteen hours) and an iPad will only take about 50 watt hours (one twentieth of 1 kWh) to charge. A  phone is less. So the battery will never use its full charge during the summer. In winter, the problem is different. If your 3 kW set of PV panels is generating 300 watts, as it might be on a sunny day in November, much of that electricity will be used already by the background household power needs. There won’t be much spare to recharge the Moixa battery.

Perhaps I am being too cynical but I think a third point may also be crucial. Today, many new domestic PV installations come with a device that diverts surplus power to the hot water tank immersion heater. Power that is not being used in the house is not exported but goes to heat water. (In the UK FIT regime, this doesn’t affect the householder’s payments because for most homes 50% of power production is deemed to be exported, whatever the actual use in the house). The average home needs about 10 kWh a day for heating hot water, implying that there will generally be few days on which all the surplus power generated by the PV panels is not productively used to heat water. And these hot water diversion devices only cost about £450 installed in a new system. Put bluntly, this form of storage is about thirty times as cost effective as a Moixa system. Even adjusting for the cheaper price of the gas typically used to heat water, the difference is still ten to one against the Moixa battery.

Terrajoule

California recently mandated that electricity suppliers would have to add some storage to any new power plant connecting to the grid. This will produce a huge surge in investment in electricity storage technologies. (If my research is correct, several 5 MWh batteries have already been connected to regional grids in the US).

If its technology is robust, Terrajoule will benefit from the Californian law and its sophisticated investors have just put in a further $11m. Its technology is appealing because it is relatively simple technology and works well at a small scale. As electricity generation moves remorselessly from centralised plants to smaller local units, storage must be made to work economically in quite small units. Terrajoule links a concentrating solar power plant producing high temperature steam to a storage unit that holds the steam (as very hot liquid) at high pressure.

Steam engine

These high pressure tanks are nothing more than cheap domestic LPG cylinders, as seen in off gas grid homes around the UK. When electricity is needed during the night, the steam is released to a standard steam engine with pistons that convert to a rotary motion generating electricity through an alternator. (The company is at pains to point out that this is not a steam turbine, think more of a 1930’s steam locomotive).

Terrajoule’s claim is that it can turn a simple concentrating solar plant into a generator of 24 hour electricity, particularly in desert regions where the sun is almost guaranteed. The use of standard, fifty  year old technologies for storage and generation means the costs are low and maintenance simple, which will be important in remote locations.

In theory I think the Terrajoule system might also work for wind. The turbine would use surplus power to heat water into steam. This would stored in Terrajoule’s cylinders and then used to drive a piston steam engine when the wind drops.

I don’t know whether Terrajoule will work, or much about its costs, but I’m certain that the UK would get better value from investing in genuinely innovative technologies like this rather than giving rather small cheques to companies enhancing existing and well understood battery technologies. One news report suggests that Terrajoule could take storage costs down to $100 a kilowatt hour, one fifthieth of the Gigha project. I know where I would put my money.

The purpose of government support is to take very risky (and hence unfinanceable) but potentially game-changing ideas to the point where they can be commercially developed. DECC's selection of two well established companies for its support from the tens of more challenging projects that entered its competition suggests it has lost any sense of purpose.

***

Simon Daniel, CEO of Mioxa sent me the comments below and has given permission for their use here. He also wants to stress the importance of domestic batteries reducing the peak of UK electricity use between 5 and 6pm. As the UK runs close to not having enough electricity generation capacity at this time of day in winter, using batteries to reduce home use of electricity makes good sense.


Hi Chris, couple of notes 

- were reusing existing light circuit in home during retrofit, and converting fittings to DC led 

- typical avg uk lighting is 2kwh per day which reduces with cfl but on a DC led circuit is assured to <400wh a day. Then on battery circuit can be shifted off peak to lower carbon night or day solar

- peak domestic in UK drives national peak as industrial demand inventory less then. Hence any shift or assured reduction during peak is useful 

- DC demand not easy to shift by price behavioural change otherwise 

- DC demand growth significant and expected to dominate with ict / IOT. Currently is about 1kwh avg ict a day, 2kwh audiovisual/ electronics etc

- DC taking over a lot of things

- our USB DC sockets can lower DC-DC up to 35v/100w so laptops, led monitors etc without an ac/DC

- inverter, ac:DC typically wasted around 30%+ and IOT will see tenfold increase in DC devices by 2020. These will further increase peak domestic issue

- USB power delivery now making this a standard so that all ac/DC could disappear and opportunity to power all this from time shift renewables . See article researched in economist http://www.economist.com/news/international/21588104-humble-usb-cable-part-electrical-revolution-it-will-make-power-supplies

- also provides resilience over lighting.elecrronics. Storm st Jude say 1/40 uk lose power

- our Maslow aggregates all distributed batteries to use as bulk storage, eg excess wind or balancing local voltage issues caused by otherwise peak solar

- by enabling local DC PV to battery, we could deploy zero cost/carbon use lighting, or PV powered ict Into urban households. Though if our system is seen not to be innovative and served ok by usual then we might not get enough support to try offering low price systems to mass market / urban or elderly

- website prices are high:indicative though if pilots go ok showing that storage is helpful for grid challenges then systems could be almost free to end users and help fuel poverty and particularly dramatically reduce (average halve peak period cumulative consumption) even with small batteries and assured co installed efficiency measures 

- it's a shame the short decc announcement did give company details of why projects deemed to be innovative from the 50+ options considered. But is perhaps difficult In short summaries to explain the myriad technical points the different projects are exploring 

***

British Gas not telling truth claiming that wholesale energy prices are rising

British Gas needs to stop peddling inaccurate and misleading statements. In its public comments, it continues to contend that recent domestic price rises are driven by the rising wholesale costs of gas and electricity. But its own published information shows that this is not  the case. In fact, the wholesale prices it pays are no higher than April 2011 and have actually fallen in the last six months. In contrast its electricity prices have risen by about 29% since 2011. Here are two comments from British Gas made after the recent changes that raised gas prices by 8.4% and electricity by 10.4%

We didn’t take the decision to raise prices lightly.  I understand people are frustrated that the price of energy keeps going up – and I’d like to explain why.

North Sea gas is running out.  We have to buy energy on the global market for our customers, and global prices are rising.

(Blog post by Ian Peters, Managing Director, British Gas Residential Energy, 18th October 2013)

We haven’t taken this decision lightly, but what’s pushing up energy prices at the moment are costs that are not all directly under our control, such as the global price of energy, charges that we have to pay for using the national grid that delivers energy to the home, and the cost of the Government’s social and environmental programmes

(British Gas corporate press release 17th October 2013)

But also in the Ian Peters blog post is the following chart. The grey area at the bottom of the gas and electricity graphs is the average price that British Gas paid for its wholesale supplies, which represent about 55% of the total domestic bill.

why_do_energy_prices_go_up_1 - Copy

Look at each chart - gas is at the top, electricity is at the bottom. Has the price of wholesale supplies risen? No, they have stayed remarkably stable for the last two and a half years.

Wholesale electricity prices have actually fallen from around £60 a megawatt hour to little more than £50 since April 2011. But British Gas domestic power prices have risen sharply in this period. The chart below gives an approximate figure for each of the four price changes introduced by British Gas in the last thirty months. (I have used the average figures quoted in the relevant British Gas press release).


British Gas price changes

Taken all together, these four prices changes have increased domestic bills by about 29% in a period when wholesale electricity costs have fallen. It is simply  not accurate for British Gas to claim that rising wholesale prices provide any justification whatsoever for increasing domestic bills. Large publicly quoted companies should be more truthful.


September NOAA temperature data - fourth highest on record, southern hemisphere highest ever

Last month’s estimated global temperature and precipitation data has just been released by the US National Oceanic and Atmospheric Administration (NOAA).  Climate data doesn’t get much attention now but it may be worth recording some of the features of the September figures. In particular, I suspect that those who claim global warming has ‘stopped’ will find last month’s data from the Southern Hemisphere, particularly the continent of Australia, quite a challenge to explain. NOAA Sept

The following are direct quotations from the NOAA report of October 23.

Global temperature

The globally-averaged temperature across land and ocean surfaces combined was 0.64°C (1.15°F) higher than the 20th century average, tying with 2003 as the fourth warmest September since records began in 1880.

The six warmest Septembers on record have all occurred since 2003 (2005 is currently record warmest).

September 2013 also marks the fifth consecutive month (since May 2013) with monthly-average global temperatures ranking among the six highest for their respective months.

Southern Hemisphere

Even with cooler-than-average temperatures in much of southern South America and much-cooler-than-average temperatures in eastern South Africa, the Southern Hemisphere was record warm for the month, with an average land temperature that was 1.20°C (2.16°F) higher than average, the third highest monthly anomaly for any month (behind August 2008 and November 2009) in this hemisphere in the 134-year period of record
 

(Anomaly means divergence from the historic average. So this paragraph is saying that last month had the third greatest monthly divergence of all months in the last 134 years. - Ed)

Australia in particular

Australia reported its warmest September since national records began in 1910, at 2.75°C (4.95°F) above the 1961–1990 average. The nationally-averaged maximum and minimum temperatures were 3.41°C (6.14°F) and 2.09°C (3.76°F) above average, also record high.

(Please do note the figures – the average temperature was not far off 3 degrees above the historic average – a staggering divergence. - Ed)

Every state and territory across the country had average, maximum, and minimum September temperatures that ranked among their 10 highest, with record warmth for all three in South Australia. The average temperature was record high in every state and territory, with the exception of Tasmania (third highest) and Western Australia (fourth highest).

According to the Bureau of Meteorology, this record-warm month contributed to a record-warm 12-month period (October 2012 to September 2013), marking the second month in a row that the 12-month mean temperature record has been broken.


Hinkley small print may mean a price of much more than £92.50 a megawatt hour

The news about Hinkley Point is welcome to those of us who believe in the paramount need to avoid climate catastrophe. But the proposed deal isn’t as simple as commentators are suggesting. The full details of the contract are not yet available but the press release gives clues to two unusual features of EdF’s deal. Simply put, these terms are likely to mean that the owner of Hinkley Point is likely to be paid more, perhaps substantially more, than the headline price of £92.50 a megawatt hour. 1)      By 2023, when the two new nuclear plants are ready to start humming, the total UK installed capacity of renewable energy is likely to be about 35-40 gigawatts. It may actually be much more if solar PV continues to fall in price. This means that some periods during the months outside winter the UK will be oversupplied with electricity. At those times, Hinkley Point will be required to reduce production. The proposed contract seems to guarantee to pay Hinkley even when it is curtailed in this way. By 2030, it could be stopped from operating perhaps 20% of the time, raising the implied price it is paid when it is working by an equivalent percentage.

2)      The headline price will also be inflated by increases in the charges imposed by National Grid to ‘balance’ the electricity network. (‘Balancing’ refers to the process by which the Grid obliges generators either to stop or to start operating in order that electricity supply precisely matches supply). These balancing charges will get larger as the percentage of non-fossil fuel power rises sharply in the next two decades. EdF appears to have obtained an escape clause which exempts it from rises in balancing and grid transmission costs.

Is Hinkley nevertheless good value for money? Probably. But contrast the payment of £92.50 - plus these unspecified extra charges - with the current subsidy for large scale solar PV. PV gets a payment of £68.50 per megawatt hour, to which is added the current price for daytime power of perhaps £40, making £108.50 in total. PV is subsidised for 20 years, nuclear for 35.

More wood fuel, an additional benefit from 'rewilding'

George Monbiot’s recent work on ‘rewilding’ has brought attention back to the degraded state of many of Britain’s uplands. Low productivity sheep pastures reduce biodiversity and increase the rate of storm runoff into rivers. Take sheep away and most uplands would quickly revert to woodland, supporting the large carnivores that he so fervently wants back in the UK. Although the UK is slowly gaining forests, it is still probably the least wooded country in Europe. Monbiot’s rewilding would also approximately double the UK’s capacity to produce wood for energy use. Today’s woodlands can produce enough fuel for about 1 million homes and rebuilding forests on upland pasture might increase this to over 2 million households. It would also increase employment in some of the least wealthy parts of the UK and make energy supply slightly more resilient. It would also reduce carbon emissions.

Two weeks ago, an attentive audience listened to talks on the bright future for British wood fuels. In a Surrey hotel that was once home to John Evelyn, a man with some claim to be Britain’s first professional forester, speakers examined how the country’s woods could be brought back into productive use. Actually, the location was doubly appropriate; Surrey is the most wooded county in England. The timing was also right. The Renewable Heat Incentive (RHI) for domestic homes, a government scheme that has taken almost as long as an oak to come to maturity, will produce a profitable market for wood pellets next year and this has stirred woodland owners and biomass stove installers into long-overdue action.

Today, over 50% of Britain’s woodlands are completely unmanaged. Despite what some environmentalists might say, this is not good for local ecologies. Unmanaged woodland becomes overcrowded, reducing the light on the floor of the forest and reducing the number of plants, birds and animals able to prosper. Careful silviculture will give us abundant wood energy and improve biodiversity as well as reducing the risk of flooding.

Matthew Woodcock from the Forestry Commission looked at the amount of wood that the south east of England would feasibly produce for energy needs. (Suspicious readers may think I have made up the lecturer’s name: a woodcock is a bird that spends much of its time in forests and its numbers have been falling as British unmanaged woods have become more overcrowded.) Matthew looked at the current level of forest cover in the south east, and offered an estimate of how much spare and low value wood could be annually harvested for energy in the region. He came up with a figure of about 1 million cubic metres, approximately enough to make the wood pellets necessary to heat 100,000 homes, slightly more than one per cent of homes in the area.

Extrapolated across the UK, the amount of woodland not currently managed for fuel or other forest products is about ten times the amount in the south east. The total amount of extra energy that is potentially available is probably about 15 terawatt hours, or approximately enough to heat one million of the 26 million homes in the UK. So, as is often said, locally produced wood cannot be a central part of the UK’s decarbonisation plans. However, its impact on local economies can be substantial. One relatively small wood products plant in Kent, Torry Hill Chestnut Products, supports 30 jobs processing 800 hectares of sweet chestnut, a rate that at least matches conventional arable farming.

Today, we were told, the UK is a net exporter of wood pellets for domestic boilers. (The conversion of Drax power station partly to wood means that the UK is nevertheless a substantial net importer of fuel from forests).  The RHI will soon offer a subsidy about 12p a kilowatt hour for households to switch to pellet stoves. Given that pellets are currently selling for about 5p a kilowatt hour, the finances of switching from oil or LPG to wood are almost ridiculously favourable once the RHI comes into force in the middle of next year.

Mark Lebus of LC Energy followed up the Forestry Commission talk, looking at the scope for industrial and commercial users to switch to wood-derived heat. LC Energy supplies Heathrow, Center Parcs and Waitrose with its wood. He was equally confident about the future of wood chips and pellets in the south east, showing how his firm could source enough material within 30 miles of any of its customers.

Nevertheless, the resources of timber are necessarily limited, given the relatively small extent of mature woodlands in the UK. And this is where Monbiot’s point comes in. Uplands used for sheep grazing are by far the easiest way of substantially extending our forest cover. We shouldn’t be looking to replicate the old Forestry Commission’s vast plantations of single species. But we can let nature back onto the uplands, gradually coaxing life back into the hills that were once almost entirely forested. Of course the farming community will complain – you might have been surprised at the vehemence of some of the newspaper comments about George’s conclusions about rewilding in mid-Wales newspapers this summer – but the future of the 2 million or so hectares of upland that is currently grazed by sheep is not growing meat. There are more jobs, more tourism, more nature in properly managed, diverse forests than there can be in livestock farming.

After a generation, when upland woods will be growing fastest, the net amount of carbon extracted from the air will be equivalent to about 1 percent of UK greenhouse gas emissions. Not a huge percentage, but in combination with the other advantages that Monbiot has so persuasively identified, a worthwhile improvement to Britain’s environment.


Why was SSE rude about the Miliband plan two weeks ago and then show today just how feasible it is?

(28.10.13 This article contains an assertion that the electricity companies were not telling the whole truth when they blamed rising wholesale prices for the need to increase their UK retail prices. A report in the Financial Times today, based on Ofcom data, makes a similar point. http://www.ft.com/cms/s/0/8c375508-3d67-11e3-b754-00144feab7de.html#axzz2j159tMhl (Paywall).  There are two curious features of the price rises announced by SSE (‘Scottish and Southern) today. First, they offer all customers a 24 month fixed tariff at the same price as their standard variable plan. So they’re doing exactly what Ed Miliband suggested, even though they dismissed this idea as ‘unsustainable’ only a few days ago. Second, they justify their price rise by reference to rising wholesale energy prices. This is particularly strange since prices for future delivery of electricity are no higher than 2012 levels, at least according to figures from Drax, the largest independent producer in the UK.

Two year fixed

The two year fixed deal is being pushed by SSE. Here’s how it sells the product on its web site this afternoon

Wouldn't it be nice to have energy prices that won't go up? That's exactly what you get with our 2 Year Fixed Price Plan#. Sign up and fix your energy prices for two years at the same prices as our standard energy rates effective from 15 November 2013, and there's no charge to fix.

So alongside its standard variable tariff it is offering a product that wholly corresponds to Labour’s proposal. In fact it is a fixed price for 24 months, not the 20 months put forward by Miliband. It is telling us it is able to lock in the supply of energy for the full period through contracts for future delivery. And, even more interesting, it is saying that the escalation of ‘green’ costs isn’t going to imply that prices in a year’s time are any more than at the moment. Or, at the very least, that it can absorb any increase within its operating margin.

This may seem a technical point but I think it is absolutely central to the energy debate. SSE is saying it can handle a Miliband freeze. And, second, SSE is showing us that ‘green’ charges are relatively small, relatively predictable and will not rise excessively.

Underlying wholesale price rises

Drax, the coal and wood power station in Yorkshire, is an independent company. It doesn’t have an arm that sells power to domestic customers. It publishes the prices it obtains for its supplies, sold into the wholesale market, which amount to about 6% of the UK power need.

Helpfully for our purposes, it also says at what prices it has sold its promises to deliver electricity in the future (‘Futures contracts’). It sells almost all of its output well in advance of production, also buying the coal and wood to make the power through long term contracts. This enables it to lock in its margins and profits in advance.

Here is what Drax got for its power in 2011 and 2012 and what it has sold electricity for in the period to 2015. All figures are per megawatt hour.

2011 (actual) 2012 (actual) 2013 (contracted for rest of year from July 2013) 2014 (contracted) 2015 (contracted)
£51.3 £55.6 £51.4 £53.5 £56.1

Source: Drax annual and interim reports

What does this tell us? First, that if SSE had bought its power from Drax it would be seeing a lower cost for the rest of 2013 than in 2012, not the higher prices it claims and, second, that 2014 prices are also lower than last year. So SSE should be able to offer a fixed price deal at a lower price that today, rather than raising its prices by more than 8% in November. Unless I am missing something major, rising wholesale electricity prices provide no justification for today’s increases from SSE.

I couldn’t obtain exactly comparable data for wholesale gas prices (though such information does exist if you have access to the price services of Platts and others ). Nevertheless from what I can see today’s wholesale gas price is pretty much the same as it was this time last year at about 2.2 pence per kilowatt hour or just under 30p a therm. If anybody has access to wholesale gas prices on spot or futures markets from 2011 to 2015, I’d be very grateful for the information.

In an earlier post on this web site I suggested that the Miliband plan could tip the energy companies into buying long term contracts for the supply of power rather than relying on volatile and expensive spot markets. I think that case I argued is strengthened by the two points I've made today.


The government is pushing the wrong sort of heat pumps

heat pump(The note below is written by Paul Dodgshun ('Paul D'). Paul has provided innumerable pieces of very helpful advice to many readers of this blog concerned about heat pumps. I asked Paul if he would summarise his views, in particular explaining to us why the DECC focus on air-to-water heat pumps will exacerbate our decarbonisation problems as well as adding to home energy bills for people sucked in by aggressive promotion of this technology. We're all extremely grateful to him for doing this. Paul and I have so far failed to get policy makers to face the facts on air-to-water pumps and we do hope readers interested in this issue make their own representations to government.) Chris Goodall has asked for a summary article that refers to helping people with their heat pump problems.  This might give the impression that I am an 'expert', whatever that might mean.  My 'expertise', if that is what it is, starts from mid-June.  I was cold called by a company that wished to sell me a 10kW(electrical) air-to-water heat pump for £16,000.  When asked for my order I said, “Due diligence first”.  I became even more suspicious when the salesman switched off his mobile phone and I could not make direct contact, in order to let him know if I would place the order.  The sales pitch had all been about the very generous government subsidies that would pay for this heat pump.

Next, on the 12th July, DECC published a document called the draft domestic Renewable Heat Initiative Policy (RHI) that was to go to Parliament for approval and implementation in April 2014.  I read the document without much interest until I arrived at the section on heat pumps.  As a retired power station engineer, I idly wondered what the Carnot Efficiency of these heat pumps might be.  Low Carnot Efficiency would mean that heat for the home would be relatively  expensive.  What I’ve found is that government is pushing us all in completely the wrong direction by subsidising air-to-water type heat pumps when it should be sponsoring air-to-air pumps which have better Carnot efficiency.

The crucial fact we need to know is that a heat pump that needs to provide high temperature water for radiators operating at 60 degrees needs a great deal more electricity to run than a heat pump that pushes out warm air at about 30 degrees. To heat a house with an air-to-water heat pumps is always going to be more costly than with an air to air pump. This is a consequence of the laws of physics. Nevertheless, in apparent defiance of these laws, the UK government is heavily subsidising air-to-water heat pumps and ignoring the air-to-air variety.

(Those with an aversion to equations can skip the next bit!)

The scene is set to do some engineering.  This requires paper, pen, calculator and a knowledge that Carnot's Law governs heat pumps.  The Law states that the theoretical maximum efficiency of a heat pump is equal to

The Hot Temperature/(The Hot Temperature – The Cold Temperature))

where Temperature is stated in degrees above absolute zero (e.g. the freezing point of water is 273 degrees above zero and boiling point is 373d degrees).  THot and TCold are the maximum and minimum temperatures in the refrigerant circuit in a heat pump when it is running.

There is also a term called COP (the Coefficient of Performance).  A COP of 5, say, means that for every one kilowatt of electricity supplied to the heat pump compressor, then 5 kilowatts of heat are delivered from the hot end of the pump. A low COP will inevitably arise when a heat pump has to pump heat up a steep gradient between a cold outside temperature and high desired water temperature in the house.

For an air-to-air pump that gets its heat from the ambient air and delivers its heat output to a house at 20C, the COP will have a certain value.

For an air-to-water pump that gets its heat from the ambient air and delivers its heat output to a water circuit, which in turn delivers its heat output to the house, another COP will be calculated.

An air blower could blow air at 30C and a water circuit would be at 60C to drive radiators that really belong to a fossil fuelled boiler.  An ambient air temperature of 5C represents a sort of average of where winter temperatures in the UK might be.

COP 5/30=(273+30)/(30-5)=303/25=12.12 COP 5/60=(273+60)/(60-5)=333/55=6.05

The ratio of these two COPs is 12.12/6.05=2.

This says that for every two kilowatts of heat supplied by the air-to-air pump only one is supplied by the air-to-water, when the same amount of electricity is used by each pump.  That says that the owner of an air-to-air pump will only pay half as much for the electricity as the owner of the air-to-water pump will do, to heat identical houses to the same standard.  SO WHY IS THE GOVERNMENT PROMOTING AIR-TO-WATER HEAT PUMPS WHICH DOUBLE CONSUMERS' HEATING BILLS, AS COMPARED TO AIR-TO-AIR?  I do not know the answer to that one.

The consequences of this anomaly spread.  If air-to-water takes twice the amount of electricity, it also requires twice the generation capacity.  As the generation is supposed to become wind turbines, the back up-gas fired generator capacity must double as well.  Now I was getting really interested.  Half the wind turbines and back-up generators did not need to be there at all:  just fit air-to-air pumps and the need goes away.  What is the government playing at?  I do not know the answer to that one either.

If you recalculate the maximum COPs for an ambient air temperature of minus5C, you get :-

COP -5/30=(273+30)/(30-(-5))=303/35=8.66 COP -5/60=(273+60)/(60-(-5))=333/65=5.12

The COPs have dropped to 8.66/12.12=71% and 5.12/6.05=85% of their former values at +5C.  Air Sourced Heat Pump COPs fall as the ambient air temperature falls.  This unfortunate characteristic causes the heat pump maximum heat output to fall as the ambient air temperature falls.

If you size a heat pump to cope with the whole house heating at a design temperature of minus10C, you get a big heat pump because the heat load is at its highest and the COP is at its lowest.  The consequences duly arrive.  The pump costs a lot because it is big; that is simple.  What is harder to spot is a big inefficiency problem with these big pumps.  Modulated (and you should not buy anything else) heat pumps have a part load characteristic that is a problem.

At full load the pump is at its most efficient.  The part load efficiency drops slowly to about 0.9 at 50% part load (not too bad), but thereafter as the part load percentage falls turns downwards and aims to zero at 0% part load. With a big heat pump it is all too easy to be spending most of the running time at something like 25% part load.  At this part load the efficiency might be something like 0.5; the pump is using twice as much electricity to shift the heat as it uses at full load.  YOU SHOULD NOT RUN HEAT PUMPS AT BELOW 50% PART LOAD

The way to combat this problem is to run small heat pumps and keep the old fossil fired boiler.  A good  lkW(electrical) air-to-air heat pump will produce something like 4kW of heat at an ambient air temperature of freezing.  Run continuously 24/7, this will supply 4x24=96kWh per day of heat to a house.  My winter quarter gas bill for a five bed, detached modern estate house states that my average daily consumption of heat is 100kWh per day.  This average can be met by a 1kW(electrical) heat pump that costs less than £1000+fitting,  AND THAT IS ALL YOU NEED TO SPEND, because you keep your old fossil fired boiler.

This boiler will heat the DHW (Domestic Hot Water) and provide extra heat for those coldest of winter days where your house heat demand exceeds the winter quarter average.  You can even close off rooms during these coldest of winter days and postpone the need for the boiler to provide any space heating at all.

I have put my money where my pen is and installed a small air-to-air.  Others who post to Carbon Commentary are doing the same and one gentleman from south-west Scotland has his twin heat pumps + oil boiler system running already, as things are a bit cooler up there.  I believe the data we will collect this winter will prove beyond any reasonable doubt that this is the way that this country should install and run heat pumps; small air-to-air wins but it does have its issues, primarily air distribution and fan noise.  I am interested in all data, problems and successes from running this scheme.

IKEA's PV figures are too sunny

IKEA is selling solar PV systems through its UK stores. Homeowners can buy a 3.3 kw system, fully installed on their roof, for a base price of £5,700. Hanergy are the contractors for the scheme. It looks a good deal but IKEA isn’t being careful with the claims it is making for the financial benefit. Actual returns are likely to be at least 15% less than the company advertises. A disappointing failure from IKEA, which trumpets its ethical standards. On its website, IKEA makes two claims about a typical system installed on a slightly shaded south facing roof in Maidstone, Kent.

a)      The electrical output of the 3.3kw installation will be 3,314 kWh a year. This figure is too high and I estimate the actual output will be less than 3,000 kWh. This estimate is based both on my own knowledge and, more importantly, on the figures coming out of the online calculator on the Hanergy site. (www.hanergy.co.uk) . For a slightly shaded roof facing due south in Maidstone and carrying 3.36 of PV panels the calculator suggests an output of about 2950 kWh on a 30 degree slope. (35 degrees would give a very slightly higher figure).[1]

IMPACT: Overestimate by about 10%

b)      IKEA uses current electricity costs of 15.32 pence a kWh (‘a unit’). The current price offered by Sainsbury Energy for a home in Maidstone is 12.68 pence for follow-on units, which is the correct comparison to make. If we assume that half the electricity generated by the PV panels replaces electricity that would otherwise be bought, then the savings will be 17% less than IKEA claims.[2]

IMPACT: IKEA savings overclaimed by about  £39 a year.

Taken together, these would reduce the potential savings from an IKEA 3.3 kW system in Maidstone from £824 to about £695, a reduction of just over 15%.

I also want to question two other assumptions in the IKEA example. First, its calculation uses a roof facing due south. Such homes are rare. If houses are randomly oriented, then the typical home's best facing slope will be 45 degrees off south and, on average, generate about 6% less than IKEA estimates in Maidstone.

The other problem concerns shade. The IKEA estimate is based on ‘10%’shading. The important thing here is that an object very nearby, such as a chimney stack, that blocks 10% of the direct light has a greater than proportionate effect on output. Electricity generation will fall by more than 10% because of the way that PV systems work. IKEA’s  output calculations give an unfairly rosy impression of the likely amount of electricity produced.

What does this all add up to? IKEA is suggesting a seven year payback for a Maidstone homeowner. The actual period for a typical house is likely to be over 10 years on a 3.3 kW system after adjusting for the four things I mention in this note. It would be longer for a home further north.

It’s presumably an arithmetic slip but IKEA also quotes a cost of £5,500 on its website as the basis of its calculations but seems to have actually stated a price of £5,700 in its press release. £5,700 is still a competitive quote and the income from the PV will provide an Internal Rate of Return (IRR) of 8 or 9 per cent in real terms with good inflation protection. So IKEA is offering something potentially valuable but it needs to be more conservative about its assumptions. Solar PV is essentially a financial investment and companies like IKEA should meet the tougher advertising standards demanded of banks.


[1] The IKEA website uses estimates from the Microgeneration Certification Scheme (MCS) handbook. These figures appear to be too high.

[2] IKEA uses figures it claims comes from the Energy Savings Trust. It should have employed current market prices for ‘Primary Rate’ units from some of the big suppliers. I used Sainsbury for my figure, EdF’s best tariff, for example, would have been slightly better today.

Labour's price cap proposals for UK energy

Despite the torrent of scorn, ‘economically literate’ people should welcome Miliband’s energy price cap proposal. There isn’t a single commentator – or energy company – that thinks that the domestic gas and electricity markets are working well. Nevertheless, the Labour proposal to cap energy prices for a two year period has been greeted with withering contempt by the energy companies and their friends. Sensible people should be more optimistic: it might be only way to begin the process of building a responsive and effective market in power and gas. Don’t listen to what the crazy fundamentalists say. When markets have failed so badly, tinkering around the edges will never work. Miliband’s proposal is the first recognition of the need to forcefully kick the energy industry into a different and more competitive equilibrium.

Nobody, but nobody, defends what has gone on in the last decade or so. The oligopoly of the Big Six has become entrenched. Prices have tended to rise more sharply than other countries, albeit from relatively lower levels, and consumer satisfaction has dipped to new lows. The regulator Ofgem has worked hard but increasingly looks outgunned by the big companies. Consumer switching has fallen even as the main suppliers continue to churn their complex and hard-to-compare offers. Even as the power companies promise to be more chaste in their marketing, the last two months has seen 49 separate changes in retail price offers. (Some of these switches have been from small players but the majority were from the Big Six).

Perhaps most critically, wholesale energy markets are highly illiquid, reducing price transparency and discouraging investment in generation because investors aren’t able to assess whether the billions going into new plant will ever make money.

Ed Miliband’s proposal, which looks as though it is an attempt to subvert the operation of markets, may actually be intended to make them work better. The logic is this: if the energy companies are forced to commit to hold prices for a twenty month period, they will be obliged to buy large amounts of power and gas in the forward markets. (A forward market allows me to buy something at a pre-agreed price for guaranteed delivery on a certain date). Otherwise the Big Six will be exposed to future rises in power prices that they would not be able to pass on. If the companies are all actively buying and selling energy for delivery in one or two years’ time they will have created a much deeper and more liquid power market.

At the moment, all the utilities are exposed to the rapid swings in short term wholesale prices. As a result they are obliged to move prices several times a year in periods of volatility. Forcing them to buy most of their power in forward markets will move the industry into a new mode of operation. Importantly, it will make long-term wholesale prices much more transparent and ‘real’, encouraging investment rather than deterring it as the jeremiahs suggested yesterday. If we are worried about the lack of long-term price signals holding back investment in new generation, Miliband’s plan is absolutely what we should want.

It can be correctly pointed out that the wholesale energy prices are only about 50% of the domestic consumer’s bill. Even if the Big Six can buy power today for delivery in 2017, it doesn’t reduce their exposure to rises in other costs. The most important of these are transmission charges (the regulated prices charged by the owners of wires and pipes and about 20% of the household bill) and social and environmental costs (about 10%, covering feed in tariff payments and home insulation subsidies among other costs).

Both of these other categories of cost are tending to rise as a fraction of the typical bill. But the expenditure is reasonably predictable because Ofgem has laid out the likely course of transmission charges and the Treasury has capped the rise in payments to sources of green energy. The Big Six will be able to budget effectively for both.  Ignoring the 5% VAT charge on the bill, the other expenditures of utility companies on metering, credit control and customer service are all controllable.

In in all, a well-managed utility company should be able to live easily with the 20 month price cap proposed by Miliband. Most importantly, the effect on the incentives to build new generating capacity is likely to be strongly beneficial as the plan improves the functioning of the market for electricity and gas to be delivered in a month or a year in advance.  Combined with an enforced legal separation between the retail arms of the power companies and their generating plant - another proposal from the Labour Party - there might at last be a chance of creating a functional energy sector for the UK.

And despite what we sometimes like to think, most other European countries have profound interventions in the operation of their utility industries and reject many of the assumptions of British market fundamentalists. Some countries regulate prices, others target financial rates of return. No other country has concluded that untrammelled independence is the right way to regulate energy producers or energy retailers.

****

Addendum: some recent comments from Ofgem (June 2013). Economist-speak but very powerful.

Our analysis suggests that liquidity in the electricity wholesale market remains insufficient. The volumes traded along the forward curve are lower than in other markets and bid-offer spreads remain wider. Qualitative feedback also suggests that firms find the current levels of liquidity unsatisfactory. In addition, small suppliers face particular barriers to accessing wholesale electricity products.

Poor liquidity acts as a barrier to entry and competition. It limits the ability of generators and suppliers to trade and manage their risks. As a result, poor liquidity prevents consumers accessing the benefits of competition: downward pressure on bills, better service and greater choice.

The abject failure of the Green Deal is clear as statistics show sharp fall in home insulation measures

The Green Deal is the government’s central energy efficiency programme. Since January 2013, householders are able to borrow money to finance measures in their home to reduce heating bills. Uptake has been slow: only 12 homes have taken out a Green Deal loan so far. The government is keen to point out that other householders have financed improvements from their own cash, or their landlord has carried out the improvements for them. Nevertheless, the catastrophic impact of the switch to the Green Deal as the main mechanism for improving the nation’s housing is becoming clearer. Statistics released last week by DECC show that the rates of new wall and loft insulation are running at less than a quarter of 2012 figures. Fuel poverty is becoming an increasingly severe national problem and the switch away from the relatively successful pre-2013 government programmes is looking increasingly mistaken, or to put in more emotional language, wholly wrong-headed. Why are commentators not shouting louder about this appalling setback to the attempts to reduce heating bills and carbon emissions? This is a vitally important issue - tens of thousands die each winter from the effects of cold homes - but the media wrongly treat home insulation as inconsequential and tedious.

The UK’s housing stock is badly insulated. Many homes don’t have proper depths of insulation in the loft and a large number of houses have unfilled cavity walls. Homes built before 1925 generally have solid – and very expensive to insulate – external walls. Along with improved heating systems (such as new condensing gas boilers) the Green Deal, and all its predecessor schemes, have targeted home insulation as the best and most effective way to reduce home energy use. Other things can help, including double glazing and draught proofing, but better insulation of the external surfaces of the house offers the best scope for cutting energy bills.

The unvarnished facts are that between 2008 and 2012, the average rate of cavity wall insulation was just under 700,000  a year. As the Green Deal replaced older programmes, new cavity insulation in January to July 2013 fell to 110,000 homes, or 220,000 on annualised basis. Improvements in loft insulation were recently running at well over a million a year, only to fall to an annualised rate of 240,000 in 2013. Similar sharp rates of decline were seen in solid wall insulation, but from a much lower and more erratic base.[1]

Chart 1: Rates of new cavity wall insulation

CWI

Chart 2: Rates of loft insulation resulting in depths of more than 125mm

Loft insulation

Chart 3: Rates of solid wall insulation

Solid wall insulation

Across these three key measures, installation rates have fallen by over 75% from 2012 with the fall in loft insulation being the most dramatic. There is no obvious explanation other than the end of the old programmes and the introduction of the Green Deal. Some insulation measures do remain funded by the major utilities, who then pass on the price to all householders in higher bills, through a programme called the Energy Company Obligation that is an adjunct to the Green Deal. The companies have been protesting vigorously about the very high cost of this scheme even though the charts above show that remarkably few homes have actually benefited from this expensive requirement or the mainstream Green Deal itself.

What else has gone wrong? Of course the complexity and ambiguities in the Green Deal have limited its appeal. The high interest rate on the financing is also stopping many people from using it. I’ve also suspected that the process of trying to help households by using outside Green Deal assessors was likely to be badly flawed.

To investigate this suspicion, I had a Green Deal assessment carried out on a house which my wife and I plan to live in after it has been rebuilt. Did the report show how we might save cash by carrying out improvements? No, the complex and unreadable documents we received recommended measures which could not possibly save us money. They also contained manifest arithmetic errors and inconsistencies, despite coming from British Gas, probably the largest backer of the Green Deal.[2] To give just one of tens of separate examples, the suggested savings from solid wall insulation are variously said to be £376, £576 or £432 in the nine pages of documentation we received.

Even more seriously than this, the measures specifically recommended for our home do not meet what is called the Green Deal’s ‘Golden Rule’, that the savings from better insulation and microgeneration should be greater than the cost of the loan we would take out to finance the measures. The five top measures recommended by British Gas would cost a minimum of £21,000 and would save an estimated £1,201 a year. (The home needs solid wall insulation and a boiler and we want to have solar panels if possible). At a Green Deal interest rate of 7%, the recommended improvements wouldn’t even cover the annual interest payments, let alone enable us to pay back the capital.

To people with reasonable incomes and well-insulated homes, the impact of fuel poverty is perhaps not recognised as clearly as it might be. As prices rise yet again this autumn, many householders will be forced to turn down the heat again and live in cold and unhealthy homes. A coordinated national effort to improve home insulation must be a priority and the Green Deal is proving an unqualified disaster and a national disgrace. We must go back to cheaper, more targeted, more comprehensible central financing of better insulation.

[1] The raw data can be found here: https://www.gov.uk/government/uploads/system/uploads/attachment_data/file/240190/statistical_release_estimates_home_insulation_levels_gb_july_13.pdf

[2] No criticism of the individual who did the Green Deal assessment is intended. He is obliged to work with software which is badly flawed and out-of-date.

David Attenborough, an unreconstructed follower of Rev. Thomas Malthus

David Attenborough’s neo Malthusianism has erupted into the newspapers again. To a respectful Daily Telegraph interviewer he says ‘What are all these famines in Ethiopia, what are they about? They’re about too many people for too little land. That’s what it’s about. And we are blinding ourselves. We say, get the United Nations to send them bags of flour. That’s barmy’.

a)    Although drought has caused some food shortages in recent years, the severe famine of 1983-85 is now almost thirty years ago. David Attenborough is wrong to see Ethiopia as a land continuously riven by famine. He is stuck with the increasingly incorrect Western cliché of the starving African.

b)    Economic progress in Ethiopia in the last decades has been highly impressive. GDP per capita has risen 50% since the year 2000.

c)    Grains are the principal food source in Ethiopia. Grain production has doubled since 2000.

d)    Overall food production in Ethiopia has also almost doubled since 2000.

e)      Grain yields per hectare are up over 60% since 2000.

f)       The UK’s population density is three times that of Ethiopia. If that country has ‘too many people for too little land’ then the UK is triply at fault.

g)      The calorie deficits of the under-nourished in Ethiopia have fallen every year in recent years. The percentage of under-nourished – still far, far too high – has fallen by over a quarter to about 40% since 2000 and the absolute number of people with too little food had decreased, even as the population has risen.

h)      The country continues to import food, as does the UK. The ratio of Ethiopian food imports to Ethiopian food consumption is far lower than the UK at around 15%. Ethiopia is also a significant exporter of some foodstuffs and what the FAO calls stimulants (ie coffee).

The Ethiopian famine of 1983-5 was a truly terrible event, exacerbated by the civil war taking place at the time.  Since then the country has made rapid strides towards reducing the scourge of undernourishment, and over-reliance on food aid, even as population increases. Good government and sensible policies are beginning to make Ethiopia less hungry. The population growth rate is falling, and will fall faster as economic development progresses (as it has everywhere else in the world).

Sir David’s comments reminded me, as they will have reminded others, of the writings of Sir Charles Trevelyan, the civil servant in charge of Ireland during the Famine of the mid 19th century. Sir Charles saw the Famine as retribution on Ireland for the moral failings - such as sloth and a tendency to have too many children - of its people. Like the Malthusians, he saw famine as the only way of keeping the population in check. A century and a half later, Sir David seems to think the same about Ethiopia. The most shocking thing is that most people appear to agree with him