Integration of European electricity markets will leave Germany controlling EU energy policy as much as it dominates financial policy today.

As renewable energy production grows across Europe, the need for better interconnection between national electricity grids increases. One country’s temporary surplus of wind power can be exported to a network that needs more sources of electricity. As interconnection improves, electricity prices will tend to equalise across the continent but at the price of the dominant producer, Germany. The implications of this are not fully understood: the market for electricity in a networked Europe will be increasingly dominated by the state of German electricity supply. When Germany has too much power, prices will be driven down elsewhere. In fact, they already are. If Germany is in deficit, markets will spike. The impact of better interconnection will be similar to the effect of the Euro, leaving Germany  in de facto control of energy markets as much as it is today in control of economic policies across the Euro zone.

I don’t mean this article to be an apocalyptic or nationalistic argument for an isolated Britain. But I do want to suggest that UK energy policy appears to ignore the impact of what is going on in Europe’s biggest economy, one in which the commitment to a full transition to low carbon electricity remains strong, even as concerns mount about the rising consumer price of power.

Germany today has about 31 gigawatts of wind power and 35 gigawatts of solar PV as well as 3 GW of hydro.  For comparison, peak German electricity need is about 65 gigawatts and minimum use falls to around 30 gw. Its wind power  is almost a third of total European capacity  and it is probably as dominant in the provision of solar electricity.  The country’s electricity grid is well connected to surrounding states. However on many occasions over the past six months German oversupply of renewable power (which is given priority access to the national grid systems) has overwhelmed the capacity of Germany and its neighbours to absorb the power. At some times Germany has been exporting nearly 20 GW to neighbouring countries. The impact, as we might expect, has been to force down the price of power, sometimes to below zero. (Users are paid to take extra electricity).

Britain expects to move from about 8 gigawatts of installed wind power today to around 50 gigawatts by 2030. Solar PV, over 3 gigawatts by the end of 2013, will increase sharply as well and is more difficult for government to choke off because installations on, say, factory roofs may make financial sense without subsidy. PV is therefore moving beyond the reach of government energy policy. 10 or 20 gigawatts of power (much not directly measured by the grid because it subtracts from building power need) by 2030 is perfectly possible.

This growth in British renewable power will have the same effect as wind and solar have had in Germany. We’ll need to export in order to use all the electricity generated. UK electricity demand reaches a minimum of around 25 gigawatts at weekends in summer (and this minimum is tending to fall). At times like this, the 50 gigawatts of wind will, by itself, sometimes exceed domestic power need. Today, Sunday 15th September, wind power will produce almost 20% of UK electricity at midday. By 2030, winds of this speed would force us to export vast amounts of power.

So the assumption goes, we need better interconnectors with Europe to provide an outlet for our over-supplied grid. Yes, of course, interconnectors will help. But we need to remember two things. First, when it is windy or sunny here, the Germans and much of the rest of the Europe will be seeing similar meteorological conditions. Second, interconnectors flow both ways: if the Germans have too much electricity, their exports will reduce prices in any country on the same international grid. Low German wholesale prices will leak into the British market within minutes.

The impact of the first point is obvious. When we have too much wind, the Germans will usually be similarly affected. We will not be able to export, even at negative prices, because the whole of Europe will probably be oversupplied.

To study this assertion, I looked at electricity production from wind power across Europe during the ten day period from 20th to 29th March this year. This period seemed appropriate because it included a sustained period of high winds in the UK from the 21st to the 23rd.  I obtained data from the electricity markets of the UK, Germany, Spain, France, Denmark and Ireland for these days. Together, these countries represent about three quarters of European wind capacity and include all five of the biggest producers.

I plotted the total amount of power generated each hour in the six countries and compared it to the capacity utilisation of UK turbines. [i]  For most of the 22nd and 23rd, the UK saw wind production of over 5 gigawatts, or up to about 17% of power need. Chart 1 shows that UK wind production rose sharply during the 21st of March, somewhat earlier than wind power increased across Europe. (As might be expected from an Atlantic storm, Irish wind power actually increased earlier than in the UK).  Assume that we have similar conditions in 2030 and 50 gigawatts of wind turbines. For about 15-20 hours, UK wind power might be able to achieve useful export prices. But once continental production had ramped up as the storm moved eastwards, prices would crash.

Chart 1: 6 EU country wind production compared to UK in late March 2013

EU vs UK wind production

The point is made more clearly by a single comparison between Germany and the UK. Germany has plans to dramatically increase its offshore wind power by 2030, though some doubt it will ever make as much progress as it intends. But from the power coming from wind from midday on the 22nd to the end of the 25th March would have contended with the UK for the limited export markets for power.

Chart 2: German wind production compared to UK in late March 2013

 German vs UK wind March 2013

It’s worth looking at what was happening in German electricity markets over the course of the storm that helped UK wind turbines deliver so much electricity to the national grid. The following chart – produced by the team at the Fraunhofer Institute in Germany – shows how the price of electricity fell as the wind gathered force. As the speed rose over 21st and 22nd March, the market price of power in Germany fell to about €10 per MWh and subsequently to well below zero.  (Compare this to the conventional UK wholesale price of about £50). On 24th March failures to estimate quite how much power would be delivered by wind and by PV, combined with an unusually large overestimate of how much electricity would be consumed meant that a large number of fossil fuel plants were contracted to produce power unnecessarily. On the 24th, the price of electricity fell to well below zero for several hours, reaching a nadir of less than minus €50.

During the entire period of the Atlantic storm passing over Germany from early on 22nd March to midnight of the 24th the price of electricity did not rise above €20 per megawatt hour, well below half the conventional price in the UK. The high winds over Germany, combined with larger than expected amounts of sun, disrupted the normal conditions in the electricity market. It wasn’t until a week later that an approximate normality returned to wholesale power prices.

In Chart 3 the blue lines represent wholesale electricity prices, falling to well below zero on Sunday 24th March. The green area below the line shows the net exports from Germany.

Chart 3: Fraunhofer data on German electricity prices and exports

Fraunhofer energy prices


Source: Source: Johannes Mayer, Bruno Burger, Fraunhofer Institute for Solar Energy Systems; Data: EEX, Entso-e

The crucial point is this. The high winds over Britain on the 22nd and 23rd March were manageable with today’s number of wind turbines. The UK had no equivalent surplus to Germany. But the expected seven fold expansion by 2030 would mean that the March 2013 storm would require the UK to be able to export power to the rest of Europe. Even this year this would have been impossible because the existing German wind and solar fleet were churning out excess power at the same time. The prices available for export from the UK would have been significantly negative, perhaps to the tune of hundreds of Euros per megawatt hour. This problem will get worse as Germany expands its wind farms, solar and farm waste digestion plants.

So we need to move on to the second point. UK energy policy currently ignores Germany, even though its existing renewable energy capacity dominates European energy markets for many days a year. Germany’s proposed transition (Energiewende) to a fully renewable future is widely regarded as impractical idealism by cynical Britons and therefore bound to fail. But, nevertheless, the move away from fossil fuel and towards low carbon sources continues in Germany, meaning that the number of hours per year during which which power prices are negative will continue to increase. A quick look at Chart 3 shows that in the week under study, Germany was exporting electricity for every single hour.

Why, one can legitimately ask, should UK consumers pay the price for huge investments in renewables when German over-investment in solar and wind is already creating surpluses for some of the year? Shouldn’t the UK just focus on building a system that takes German over-supply – at prices close to zero – and turns this electricity into methane (‘Power to Gas’) for use when power is in deficit? Otherwise Germany will run the European energy market as it today dominates the financial activities of Greece, Italy, Spain and Portugal. Traders on the German power exchange will influence power prices across Europe. The focus on variable renewables across Europe, and the low prices at times of high winds should force the UK to find way of taking the German surplus and storing for later use.

The welcome massive ramp-up of offshore wind in the UK will often produce large electricity surpluses.  Assuming that export markets will accept these surpluses is a dangerous trap into which UK policy-makers are quickly leading us. We need to insulate the UK from German dominated price swings as European interconnection improves. This means storing UK electricity at times of surplus and building enough extra capacity to capture the cheap exports from Germany.

As readers of this blog will know, I think the only commercial way of storing electricity is by converting to natural gas.


[i] I used European Wind Energy Association (EWEA) figures for the installed power of UK wind. This figure is somewhat higher than the figure used by the UK market manager Elexon , which excludes wind farms not connected to the high voltage National Grid lines. EWEA includes some or all of the smaller wind farms that are connected to local distribution networks.

Self promotion (with profuse apologies)

Thank you very much to Mr G. White for the latest review of 'Sustainability' on the Amazon web site. This is a short, small book but a frightening but necessary book to read. Chris Goodall is a very well regarded author on green and environmental issues but he is no 'tree hugger'. The facts are presented dispassionately looking at plain and simple economics, and practical aspects of resources and demand. This book is a fine general read - the sort of book that you can read on a train or air journey - but is a useful primer for students and teachers and those who have a more academic interest in the subject. This book is logically laid out, well written and authoritative. The amount of water required to 'make' one kilo of beef, or grow arable crops or make a pair of jeans should make us all sit up and take note, for example. Well recomme

Large US study shows wind turbines have no impact on house prices.

The largest ever study of the impact of wind turbines has concluded that they have no effect on property prices. A paper from the US Lawrence Berkeley National Laboratory looked at the sales of 7,500 homes between a few hundred metres and 15 km from a wind farm. In a very sophisticated and peer-reviewed study using a wide variety of different mathematical models, the authors conclude that the impact of nearby wind turbines on the prices of homes is negligible. In summary, ‘homes located near the wind facilities that transacted more than once were found to have appreciated between those sales by an amount that was no different from that experienced by homes located in an area many miles away from the wind facilities’. It sounds a simple task to determine whether wind turbines affect property prices. Just observe how the prices of home closer to wind farms change in relation to house prices nearer away, we’d quickly say. Researchers have found it far more difficult than they expected and only two studies have ever been published in academic journals. Too many factors intervene to make comparison easy. For example, homes close to wind turbines might typically be in areas of high landscape value and such homes might have inflated in relation to houses in large towns. As a result of the myriad conceptual difficulties, academic studies have relied on unreliable estate agent opinions and used only small sets of data. Moreover, few researchers have actually been to the homes in their study to determine, for example, the degree of visibility of the turbines.

The Lawrence Berkeley study seems a real advance on previous work (though this makes it extremely difficult to understand). A large database of homes was used by the researchers and every single house in the study was visited and assessed. The overall conclusion is likely to be resilient, and is in line with the best other surveys around the world. No statistically robust effect on house prices arising from the construction of wind turbines can be observed.

That said, it’s important to note some of the individual findings, even if they don’t meet conventional tests of statistical reliability.

1)      There is some evidence that houses very close to a turbine might lose 3-4% of their value but this effect may fade over time. (The authors of the study point out that this is similar to the effects observed on house prices when new roads are constructed or high voltage transmission lines constructed).

2)      The degree to which a turbine is within view of the house has no measurable impact. In fact, homes with the most visible turbines had higher prices than expected.

3)      There may be a negative effect on nearby house prices at the point at which a wind farm is mooted. But this effect seems to fade completely when the farm is constructed. (This finding has been seen in other surveys as well, including those in the UK).

4)      Adjusting for property size and other variables, homes more than five miles from a wind turbine on average sold for less than homes closer by.

The study concludes ‘no evidence is found that home prices surrounding wind facilities are consistently, measurably and significantly affected either by the view of wind facilities or the distance of the home to those facilities. Although the analysis cannot dismiss the possibility that individual homes or small numbers of homes have been or could be negatively impacted, it finds that if these impacts do exist, they are either too small and/or too infrequent to result in any widespread, statistically observable impact’.

The UK Environment ministry is reported to have commissioned a study of the impact of wind turbines on house prices. Although most people regard it as ‘obvious’ that wind farms affect property values, this huge US study should prompt re-examination of this conclusion and oblige DEFRA’s researchers at Frontier Economics to recognise the high degree of difficult in making robust assessments.

Switching to electricity to generate heat is a mistake

Heat

Submission to the UK Select Committee on Energy and Climate Change

(This is a submission to the Energy and Climate Change Committee of the UK Parliament, which is currently asssessing the country's policies on the provision of heat.


 Summary

  • In this note I want to advance the idea that the UK is gravely mistaken in trying to substitute electricity for gas for the purpose of home heating. Heat demand is much more seasonal than electricity need. Switching to heat provided by electricity will disproportionately increase peak demand for electricity, obliging the UK to waste large sums on capacity payments for electricity generating plant that will work for a few hours or days a year. The comfortable wisdom that providing heat using electricity is good for the UK is utterly wrong.
  •  In fact, we should stick with gas as the principal source of domestic heat. The infrastructure is there already and gas storage is simple and cheap. Crucially, we need to ensure that this gas is made from electricity at times when the grid is in surplus. This technology is called ‘power to gas’ and is a topic of central interest in other European countries. The UK has yet to wake up to the potential of this idea and the Committee could have a crucial role in bringing it to the attention of UK policymakers.

The size and seasonality of heat demand for homes.

1)      The domestic heat need for the UK is approximately 400 terawatt hours (26 million households multiplied by about 16,000 kWh per home). This is over 4 times the need for electricity in the home.

2)      The requirements for energy for domestic heat are far more seasonal than the need for electricity. In December, a cold day can see an average 24 hour residential heat demand of as much as 250 GW, almost ten times the need for electricity in the home and four times the maximum need for electricity across all sectors. In mid-winter, domestic demand for gas dominates industrial and commercial use. By comparison, on a warm summer’s day, heat demand in homes is restricted to ten or twenty gigawatts of hot water heating.


Heat, electrcity demand

3)      Within the winter day, the demand for residential heat peaks in the morning and in the early evening. This is approximately the same as for electricity, adding to the problem of peaking.

4)      The need for residential heat may reach 500 GW over short periods, about twenty times the maximum need for domestic electricity. This single comparison should alert us to the danger to using electricity to substitute for gas heating.

5)       The sharp peaks in winter heat need can be accommodated by the current mix of gas boilers combined with much smaller amounts of oil, LPG and of electric heating (much of which is taken from the grid at off-peak times when demand is relatively low).

6)      Any part of the UK’s energy policy that does not recognise the extreme seasonality in heating need will fail.

Why is this important?

7)      The government has plans for the decarbonisation of energy use. Its proposals for domestic heat are, in summary:

a. Increase biomass use

b. Large numbers of solar thermal collectors on homes

c. Hugely expand the number of homes with heat pumps, replacing domestic boilers

8) Biomass, solar thermal and some types of heat pump are strongly encouraged by the RHI (Renewable Heat Incentive). The government talks of installing many millions of biomass boilers, solar thermal collectors and heat pumps by 2020.

9) In addition, the government hopes that the Green Deal and Energy Company Obligation will decrease the demand for heat by improving residential insulation. But the evidence is that even aggressive insulation efforts will not cut the heat demand of the average home by more than about 40 percent. Achieving greater savings, householders find, can be extraordinarily expensive. This reality is too often brushed aside. Insulation is, at best, only a very partial solution to the problem of the cost and carbon emissions from heating.

10)  Policy a). Increase biomass use. The total supply of wood and wood products such as sawmill waste in the UK is about 17 million tonnes per year. (Source: Tony Weighell for DEFRA at http://jncc.defra.gov.uk/pdf/Biomass.pdf). The average energy value of timber products is about 4,500 kWh per tonne. The average home uses about 16,000 kWh for space and water heating annually. Therefore a home heated by wood requires about 4 tonnes a year. If ALL the UK’s wood production was used for domestic heating, biomass might be able to supply about 4 million homes, or around 15% of the UK properties. Clearly imports might add to the availability of wood, but biomass can never realistically cover more than a small fraction of the UK’s heat need. Perhaps 80% of UK homes would, in any event, find it difficult to accommodate a pellet or wood chip biomass boiler.

11)  Policy b). Solar thermal collectors. The total heat collected by an array on a house is unlikely to exceed 2,000 kWh a year. Installed on every house in the country, the total contribution to domestic heat need would be less than 10%, after excluding flats and other properties with no access to a roof. And, most importantly, solar hot water systems do not provide a significant contribution to heat requirements during the winter. Therefore they do not assist with the problem of the variability of heat demand.

12)  Policy c).This leaves heat pumps as the main government instrument for decarbonising heat. The government now includes domestic air-to-water heat pumps under the RHPP (Renewable Heat Premium Payment) and RHI. (The comments in the following paragraphs apply mostly to this type of pump, not the ground source variety). Serious concerns have been expressed about the effectiveness of air source heat pumps by many users and energy commentators. They are often badly installed, the controls are too complex to be used by ordinary householders and don’t heat the radiators properly, leaving the house cold.

13)  They also often don’t save the householder money. As other people, such as Paul Dodgshun, will have said retail electricity is about three times the price of gas. Only heat pumps with a Seasonal Performance Factor of more than 3 will reduce household bills in a property previously heated by gas.

14)  The actual Coefficient of Performance of even a well-installed modern air to water heat pump during times of very cold weather is often less than 2. This poor performance is mostly down to immutable laws of physics (please note the comments of Paul Dodgshun at http://www.carboncommentary.com/2013/03/25) and not even a strong government can do much about this. For every unit of electricity consumed when outside temperatures are lower than -5 degrees less than two units of heat are being generated. (Some people have found the number is often even lower than this. See an article on my web site at http://www.carboncommentary.com/2012/02/08/2268.) The strikingly poor performance of air-to-water heat pumps at times of cold weather is, of course, happening when overall heat demand is at its highest.

15)   The impact of the installation of large numbers of heat pumps is therefore to significantly increase electricity use at times of peak demand. I million heat pumps, might add between 10 and 15 GW to the UK’s peak need, adding about a quarter to the level of electricity demand at around 5-5.30pm on the coldest weekdays in December and January.

16)   This problem is not recognised by policy-makers who continue to use average Coefficient of Performance figures for heat pumps and do not acknowledge the striking fall off in efficiency at times when UK temperatures are well below zero. Neither do they acknowledge the impact on household electricity bills of lower cold weather efficiency from air-to-water heat pumps. A kilowatt hour of heat will cost as much as eight or nine pence. This twice what customers on the gas grid would pay, 50% more than biomass heating and very roughly the same as oil central heating at current prices. In fact, ASHPs will sometimes cost more than off-peak dual rate electricity. So for almost all households the installation of an air-to-water heat pump makes no financial sense even if they carefully install a modern and well-engineered version.

17)   What about the UK as a whole? ASHPs will increase peak electricity demand, as well as causing growth, albeit at a slower rate, in average power use. This is an absolutely critical point and should be fully explored.

18)   Increasing peak electricity usage is bad for a number of reasons. The most important of these is that it requires a society such as the UK to construct and maintain a larger fleet of standby electricity generating plants (‘peakers’), probably powered by fossil fuels. As DECC is currently noticing, this is expensive. A gigawatt of standby gas fired capacity is going to cost perhaps £60m a year in capacity payments and, at the margin, will be used a few hours a year. (We don’t have the precise figures for the capacity payments yet).

19)   In paragraph 15, I noted that I million ASHPs might add 10 to 15 GW to peak demand in the UK. Let’s assume the actual figure is 12 GW. The capacity payments to cope with the increase in demand from these 1 million heat pumps are therefore likely to be around £720m a year.

20)   Arithmetic suggests that a single heat pump therefore imposes an incremental cost of £720 a year on UK energy users. (It could turn out to be £500 or it could actually be £1,000. The point is that this deadweight social cost is very significant but is never included in the costing of financial support for this technology).

21)   To put this even more clearly, the owner of this incremental heat pump might see an electricity cost of around £900 a year for his or her heating bill, less the savings in the fuels replaced by the ASHP, such as oil, as suggested in paragraph 16. The houseowner may or may not see an increase in fuel bills. But the marginal cost to society as a whole will be about £720, just from capacity payments, for a single heat pump. If the average heat pump uses about 7,000 kWh of electricity a year it is therefore receiving an entirely invisible subsidy of about 10p a kilowatt hour, more than solar PV or onshore wind. It will not be long before the opponents of decarbonisation fix their eyes on this unnecessary cost.

What should the UK do instead?

22)   Presently, gas boilers provide most of our domestic heat. They are highly efficient, very safe, and reasonably reliable if maintained properly. Cheap to install and simpler to operate than ASHPs, gas boilers are wonderful things. As a society, we have an infrastructure of gas pipes, gas storage plants and firms that install and service domestic gas boilers. All other things being equal, we should want to maintain this existing resource and definitely not switch to a new technology such as heat pumps with clear problems of reliability and complexity for homeowners.

23)   As a society we decided to move away from gas for heating because for two reasons: First, gas is subject to severe price swings and the long run trend in gas prices is likely to be upward. (The UK’s gas prices are set by the world market. Whether or not the UK successfully develops a gas fracking industry will not significantly affect the price we pay either way). Second, burning gas in large quantities is incompatible with the UK’s climate change policies.

24)   How can we reconcile the need to reduce carbon emissions and still stick with a domestic heating infrastructure dominated by gas? There is only one way forward: a drive to develop renewable gas.

25)   Renewable gas from anaerobic digestion will never be able to generate more than 10 per cent of our gas needs. In fact I doubt it will ever rise to more than five per cent.

26)   A much more interesting opportunity, which I hope the Committee will explore with an open mind, is to convert surplus electricity into gas, and pump it into the existing gas network and storage facilities, for use when heating demand is high. In countries exploring this option around the world, such as Germany, Denmark and parts of Australia, the expectation is that ‘power to gas’ will achieve four things

  • A reduction of peak electricity need from what would otherwise pertain.
  • A reduction in the amount of electricity storage needed in the era of high renewables penetration
  • Cheap and very low carbon gas.
  • More stable electricity prices

27)   How does ‘power to gas’ work? At times of surplus electricity, such as when the wind is blowing strongly or the sun is shining brightly, the grid has too much power. If the UK meets DECC’s projections for wind, biomass power and nuclear, there will be many days each year, usually in the warmer half of the year, when far too much electricity is produced. I’m afraid DECC believes that improving interconnection with Europe will alleviate this problem. This is an error. If the wind is blowing here, it is blowing (perhaps not as strongly) across all of northern Europe. The surplus electricity arising from a gale cannot be stored in any significant amounts. Despite what is sometimes optimistically said, no conventional storage technology can hope to hold more than a few hours excess power. We might, just might, have the capacity to store two hours electricity use by 2020. We need to be able to store two months’ worth if we are to take surplus power in summer and use it to meet winter heat demand.

28)   Cold and dark winter early evenings are when electricity demand peaks. But as my first paragraphs pointed out, the peak in overall energy use comes from the huge expansion in heating demand at these times. The UK and other countries therefore face the urgent need to store summer surplus electricity as gas. The idea is simple: turn spare power into hydrogen through electrolysis (cheap, reliable, scalable, modular) and then react hydrogen with CO2, to create methane (natural gas) either through the well-known Sabatier reaction or through transformation with micro-organisms, such as advocated by the innovator Electrochaea. Both processes turn 1 MWh of electricity into about 620 kWh of gas in terms of calorific value.

29)   The gas network has a storage capacity several orders of magnitude greater than any conceivable alternative. In Germany, for example, the network of pipes, pumping stations and underground storage caverns can hold 200 days use. Contrast that please with the UK’s pumped storage capacity today of about one hundredth of one day’s electricity demand.

30)   When energy industry executives are first exposed to the idea of storing electricity as natural gas, they are incredulous. Their training and industrial experience tells them their business is to turn cheap gas into expensive electricity. Why, they smile, should we take wholesale electricity that sells for £50 a MWh and turn it into natural gas that commands perhaps a third of this amount after calculating conversion losses?

31)   The power markets are changing. The growth of UK renewables (with zero marginal cost of operation and intense peaking of supply) will alter the pricing of electricity dramatically. Germany shows us what is going to happen soon. During June 2013, the average day-ahead power price was about €28.3 per MWh (just over £24), far lower than the UK. In fact, the average German power price was no higher than the price of gas per unit of energy. But, even more importantly, the variability of wholesale prices was huge. The Standard Deviation was over €14.6. What does this mean? It means that across the month electricity was worth less than €13.7 (about £11.76) a MWh almost 16% of the time. This is far lower than the price of gas, even at its summer UK minimum.

32)   Some of the time in June, German electricity changed hands at sharply negative prices as high solar and wind power output swamped the country’s capacity to export electricity. In some senses, periods of very low electricity prices are good. Consumers might benefit. In other senses, here as in Germany, it is an utter disaster as the negative price signal warns utilities of the risk of investing in expensive new generating plants. We’re certainly seeing this in the UK already.

33)   The crucial points are these: if ‘power to gas’ plants can siphon off surplus electricity from solar and wind, they will a) produce low carbon methane for the natural gas network and b) stabilise increasingly chaotic power markets. Moreover, we will have the capacity to meet high levels of heat demand in winter using surplus power. And, also importantly, we will use – and not waste – the output from the huge number of offshore wind turbines the UK will install in the next two decades. ‘Power to gas’ improves the value of renewable sources of electricity by, in effect, making them dispatchable power. Lastly, we will avoid having to invest in huge amounts of standby electricity generation capacity that sits waiting for the few hours a year of peak demand.

34)   The Committee will be all too aware of how soon the UK will start getting significant and unpredictable short term and seasonal surpluses of electricity. The central forecast of the Committee on Climate Change is for 50 Gigawatts of wind power by 2030. Nightime summer demand is now typically below 25 Gigawatts and this number will probably fall as heavy industry declines further and home energy efficiency  improves. So by 2030 an Atlantic storm in June will see power surpluses for hours and perhaps days just from wind power alone. Even in December, night power demand is less than the maximum wind power output from 50 GW of wind. The more variable renewables we install, the more we need ‘power to gas’.

Conclusion 

The proposal I am advocating in this paper is to convert surplus electricity to convert into gas for use in heating homes in the winder. This will a) provide a market for electricity when supply exceeds demand and b) reduce the need for peaking gas plant when demand exceeds low carbon electricity supply. I urge the Committee to investigate this opportunity further because I believe it is the only conceivable means of providing low carbon heat to UK homes and stabilising the UK electricity grid without enormous capacity payments. By contrast, air source heat pumps add to the UK's problems, despite their extravagant UK policy support.


If you are interested in the prospects for Power to Gas, you might be interested in reading about Electrochaea's Danish prototype plant at www.electrochaea.com/uploads/1/1/4/0/11408432/press_release_20130813_-_electrochaea_commissions_foulum_project.pdf 
and E.ON's 2MW Falkenhagen plant at http://www.eon.com/content/dam/eon-com/%C3%9Cber%20uns/Innovation/Energy%20Storage__PowertoGas.pdf. The E.ON plant was formally opened on 28.08.2013)
 

Chris Goodall, 25th August 2013

Wind near-cost competitive with fossil fuels, says US Department of Energy

The latest data on US wind power provides some extraordinary statistics. During 2012 about 13 gigawatts of new capacity was installed, almost twice the UK’s total wind power. This provided about 43% of the net additions to US generating plant. Most strikingly, the Department of Energy study suggested that US wind farms are supplying power to the various regional grids at an average of $ 40 (£27) a MWh. This is broadly competitive with the cheapest gas-fired generation in the US and little more than half the current price of UK electricity. Lastly, and perhaps most interestingly from the UK perspective, the DoE study suggests that the cost to the grids of integrating wind power is less than $12 (£8) a MWh. This is a tenth of the estimated costs suggested by the Global Warming Policy Foundation last year. It’s no surprise that the DoE’s authoritative and carefully researched work isn’t currently featured on the GWPF website. Is wind competitive?

By most criteria, US wind power is now nearly competitive with fossil fuels, even in the era of cheap shale gas. The DoE report  suggests that the prices agreed between wind farm owners and electricity buyers (Power Purchase Agreements or PPAs) are now roughly competitive with the top end of conventional generation.

US wind prices

This isn’t complete proof of cost parity – far from it. Companies installing wind turbines get substantial tax credits. But the latest data shows that the cost of onshore wind power in the US is now very roughly at the same level as gas generation. And it is lower, much lower, than the costs of  any form of generation in the UK.

What about the costs of running wind alongside other sources of power?

The most aggressive  and ill-informed criticisms of wind power in the UK have come from commentators suggesting that variable wind power imposes huge extra costs on the rest of the electricity system. Not so, says the US study. It looked at many different estimates of the cost of integrating intermittent wind into the US grid system. In general the figures were less than $12 a MWh, about one tenth of a recent estimate from the wild men of the Global Warming Policy Foundation.

integration costs


(Some notes: this chart plots all the available estimates of wind integration in $ per MWh (y axis) with the maximum percentage of total electricity output that could be provided by wind (x axis). Sorry if this is unclear on the screen).

Add the PPA price (of say $40/MWh) to the integration cost (of say $12/MWh) and you get figure of about £35 a MWh in UK currency. Today, gas generation of electricity isn’t profitable at £50 MWh in this country. We must be doing something badly wrong if the country with the best wind resources in Europe isn’t able to get the price of wind down to below gas.

In addition to the benefits to energy consumers, the rapid expansion of wind energy in the States is aiding the US economy. Almost three quarters of all wind turbine costs were spent in the US with exports of wind equipment also growing sharply. US manufacturers continued to reduce the cost of making the turbines.

Wind is still only about  5% of US power production (about the same as in the UK) but forecasts suggest that after a weak 2013, turbine installations will pick up again. On top of 60 gigawatts of existing capacity installation companies have applied for 125 gigawatts of further transmission capacity to the grid operators. Not all of the wind farms in this queue will ever get built but wind will provide increasing fractions of US power and probably at costs roughly  comparable to gas power. If it is true there, it could be true here as well.

Poorer households disproportionately affected by rising energy prices

  Rising energy prices have had a disproportionate impact on the less well-off. Data published by DECC shows that lower income households have cut back more on gas and electricity use than homes with more prosperous occupants. Despite rising bills, electricity consumed by the wealthiest homes hasn’t fallen since 2005 but the poorest households have cut their use by 13%. Gas usage has gone down a quarter in homes in the bottom half of the income distribution, much more than the more prosperous households.

Gas and electricity consumption are gently falling in UK homes. The amount of gas used depends on winter temperatures but the overall trend is clearly downwards. Some of this fall is driven by better insulation and new condensing boilers but rising prices have also forced UK homes into setting thermostats lower. The average (‘mean’) electricity use was 4,600 kWh in 2005 and 4,200 in 2011, the latest year for which figures are available. This is an average reduction of 9%. Gas savings were more substantial, with the average falling from 18,600 kWh to 14,100 in the same period, a cut of 24%. Even the cold year of 2010 didn’t interrupt the average fall.

Closer examination shows the impact of lower incomes on the change in energy use. Gas consumption  – used for hot water, some cooking and heating in about 80% of UK homes  - fell by 27% in the poorest households, almost twice the figure for the very richest.

Gas use by  income

Some of the difference may arise from the targeting of insulation efforts on the old and those in receipt of benefits. But this is nowhere near enough to explain the difference: about 10% of UK households had cavity wall insulation installed on a government programme between 2005 and 2011 and this might have saved – at best – 25% of the gas bill. Even this entire effect was focussed on the bottom half of the income distribution (which it wasn’t) it wouldn’t explain more than a small fraction of the difference between rich and poor. The plain fact is that rising prices caused poorer households to run their homes at lower temperatures.

The pattern is the same with electricity. The bottom half of the income distribution made major savings and the wealthy made fewer cuts. In fact, the very richest homes made no reduction at all, compared to an average of 9% across all households.

Electricity consumption by income

Perhaps this is what we should have expected. Energy is a large component of household expenditure in poorer homes. To the rich, it is almost unseen. I think we should all be troubled by the apparent impact on winter temperatures in the less prosperous half of UK society. And why the wealthy seem so uninterested in energy saving.

Seven facts about Heathrow airport that need to be better known

The plaintive wails of BAA about the need for expansion at Heathrow are growing in intensity. This is understandable; Heathrow is a commercial airport, run for the profit of its Spanish owners and a bigger airport will make more money. In its astute lobbying, BAA paints a sad picture of an unusually constrained airport holding back the trading efforts of UK business because of a crying lack of capacity and inadequate connections to the growing countries of the east. These stories have gained currency in the press and elsewhere. They are wholly wrong. There may possibly be an argument for a new London airport, sited to minimise the nuisance caused by noise, but there is no compelling reason for Heathrow expansion. 1, Heathrow is predominantly a leisure airport, not one mostly serving business needs.

The 2011 passenger survey shows that over two thirds (69%) of passengers are travelling for leisure. 31% are on business.

Source: http://www.caa.co.uk/docs/81/2011CAAPaxSurveyReport.pdf  (Table 2.1)

2, Business travellers are more likely to be going to an internal company meeting that visiting customers. Many of those using Heathrow could easily use other forms of communication.

The survey suggests that 10% of all Heathrow travellers are on their way to a company event. Fewer -  9% of passengers -  are travelling to see customers.

Source: http://www.caa.co.uk/docs/81/2011CAAPaxSurveyReport.pdf  (Table 18.4)

3, Business travel from Heathrow is falling, not increasing.

The number of business passengers using Heathrow (including transfer passengers) was 24.3 million in 2000 but 21.5 million in 2011. The number of business travellers terminating at Heathrow was 18.5 million in 2000, falling to 15.1m in 2011.

Sources: http://www.caa.co.uk/docs/81/2000CAAPaxSurveyReport.pdf (Table 4 and Table 5) and http://www.caa.co.uk/docs/81/2011CAAPaxSurveyReport.pdf (Table 2.4 and Table 3.4)

4, Almost all users are happy with their experience at Heathrow. The airport infrastructure delivers user satisfaction.

In a 2012 survey, 87% had a positive view of their airport experience. Only 3% had negative views. (These numbers are very similar to Gatwick and slightly less good than Stansted). 74% had no criticisms at all of Heathrow. 45% could think of no improvements that might be useful. The average perceived queuing time for inbound passengers was 11 minutes, far less than passengers considered a reasonable maximum.

Source: http://www.caa.co.uk/docs/33/CAP%201044%20CAA%20passenger%20research%20satisfaction%20with%20the%20airport%20experience%20(p).pdf

5, The airport is not operating at capacity.

Heathrow remains very busy, but the total number of flights in the year to June 2013 was down 2% from the previous year. This fall was slightly sharper than UK airports as a whole.

Source: http://www.caa.co.uk/docs/80/airport_data_prov/201306/June_2013_Provisional_Airport_Statistics.pdf

6, Delays at Heathrow are only slightly worse than at other airports. Its terminals and its runways are coping with the demands placed upon them.

The most recent CAA data shows that 75% of flights departing from or arriving at Heathrow were punctual (defined as operating to within 15 minutes of the scheduled time) for the year to March 2013. The average for ten largest UK airports was 79%. The average delay was 14.0 minutes at Heathrow compared to 12.6 minutes for all the airports. Heathrow’s average delay was less than Gatwick or Manchester.

Source: http://www.caa.co.uk/docs/80/AviationTrends_Q1_2013.pdf (Section 7)

7, The number of cities connected to Heathrow by long haul flights is greater than any other European hub airport. The total number of seats on these flights is far more than Heathrow’s nearest competitor. The airlines using Heathrow are becoming more oriented towards shorter flights, not travel to the fast growing countries of the east and south.

A 2011 study commissioned by BAA, the owners of Heathrow, said that Heathrow had daily long haul connections to 82 cities around the world. Its nearest competitor, Paris Charles de Gaulle, had 78. But the number of seats on these flights was 25.2m in the case of Heathrow and 14.0m for Paris CDG.

Importantly, the airlines using Heathrow have chosen to move away from long haul flights, cutting seats by about 10% since 2005 while increasing short haul capacity by similar percentage. The air travel market appears to be indicating that it has no shortage of long haul flights from Heathrow.

Source : http://www.frontier-economics.com/_library/pdfs/Connecting%20for%20growth.pdf  (Table 5)


Many of us oppose Heathrow expansion because of its likely impact on carbon emissions. But we can also be confident that there is no current financial case for a third runway, except in the eyes of the airport’s owners and its multitude of lobbyists.

Stephen Emmott's central mistake - human population growth isn't out of control

  The first chart in Stephen Emmott’s ‘10 billion’ shows the world’s population for the last twelve thousand years. The growth is concentrated in the last couple of centuries. The choice of axes means that the human eye sees the recent increase as rapid, and increasingly so. We are supposed to panic.

Stephen Emmott's chart of world population

Population curve.jpg

 (Source: this graph appears to originate on Wikipedia, where it is called population_curve.svg.)

This is an extremely misleading chart. In fact, human population growth has slowed markedly and consistently since the late 1960’s. The rate peaked in about 1968 at around 2.1% but is now approximately 1.16% per year. (The lower levels at the start of the period the effect of starvation induced by Mao’s Great Leap Forward). In all but one year in the last twenty five the growth rate of population has fallen.

World population growth rate

Source: UN World Population Prospects: The 2012 revision

Long run projections from the UN Population division suggest that the world population will continue to grow increasingly slowly until it peaks at some point just after the turn of the next century. By that time the globe will be home to about 10.5 billion people, or about 50% more than at present.

World pop forecasts 2100

Of course, forecasts are only forecasts. Why should we have any confidence that the UN’s numbers are even roughly correct? Because many individual countries have gone through what is known as 'the demographic transition' in the last one hundred or so years. Before the transition, death and birth rates are high and roughly equal, meaning population is stable. Then economic development begins and death rates fall. Population grows. Some time later, birth rates also fall, and after a period population growth falls, often quite rapidly.

Demo tranistion


European countries all went through their demographic transition at some stage in the last 150 years. The growth rate of European population fell from about 1% per year in 1950 to below 0.1% today.  Many Asian and American countries have also stopped growing rapidly. 


Growth rate Europe.jpg

Another way of looking at the likely increase in future population is to track the number of children borne to the average woman. If each women has a large number of children, then population is likely to grow rapidly. Those countries in which the fertility rate falls below about 2.1 children per woman will eventually experience falling population. The number of children isn’t sufficient to replace the existing number of inhabitants.

Many people, including Professor Emmott, seem not to release how steeply and consistently the number of children per woman has fallen in most countries of the world since the 1960s. The current  rate – about 2.5 – is high enough to cause population to continue to rise for several generations to come. But the rate of fall in global fertility is sufficiently fast to make it likely that the rate will decline to below 2.1 children per woman within the next twenty or thirty years.

TFR world

Strikingly, almost 50% of the world’s population lives in countries in which women have less than 2.1 children.  This statistic needs to be remembered when we think about population: half the globe  is going to see falling population relatively soon. The table below lists the current fertility rate for the biggest countries in the world

TFR largest 10

In seven out of the ten most populous countries, the fertility rate is already at or below the replacement level. (This doesn’t mean population is declining yet but – absent inward migration – it does mean that the growth rate will fall below zero within a generation or so).

The countries with very high fertility rates are mostly in western Africa. In Niger, singled out for particularly disparaging comments by Professor Emmott, women have an average of seven children and this number shows little sign of declining fast. But in most other places, fertility is falling, often rapidly. Despite what Stephen Emmott says, there is no general world population problem. Nevertheless, we should have real concerns that in a small number of countries, almost all in Africa, attempts to cut population growth have not yet been successful. That doesn't mean that they don't recognise the problem and aren't doing something about it.

Apart from in Africa, the world’s population is expected to increase by only a small fraction by 2050.

Source of pop growth to 2050


Despite the evidence of this chart and the other data in this note, Professor Emmott wrongly tells us that the attempts to restrain the increase in human numbers have not worked and accuses policy makers of naivety.

Saying ‘Don’t have children’ is utterly ridiculous. It contradicts every genetically coded piece of information we contain, and one of the most important (and fun) impulses we have.

I think Emmott may be confusing reproduction and sex here but the more important point is that most societies have actually been remarkably good at introducing policies to help parents reduce family sizes. Increasing the average age of marriage, more contraceptive availability and better education for women all help. Emmott denies this in a few sentence of generalised pessimism including the extraordinary phrase ‘contraception .. is not a viable solution’. Yes, in a relatively small number of African countries, including Niger and its neighbours, progress has been slow but across the rest of the world population growth has slowed sharply and will continue to decline. By the way, Emmott's assertion that we might see a population of 28 billion by 2100 relies on an assumption that female fertility stays at exactly today's levels for the next eighty five or so years, although it is has fallen every year for the last half century.

I have to admit that I found the population sections of Professor Emmott’s book utterly wrong-headed and my emotions may be stirring anger. Emmott’s cheap and lazy comments about what he sees as the generalised failure of developing countries to restrain a surge in population are wholly unjustified and a slur on the hard work and real progress we are seeing in most of the world.

(As an antidote to the ill-informed pages in Stephen Emmott's work I strongly recommend Fred Pearce's wonderful book Peoplequake, which shows why concerns about unrestrained population growth are so misguided.)


'10 billion': a strangely unscientific and misanthropic book

ten billion (July 11th 2013. Some of the errors specified in this article have now been corrected by Professor Emmott. Details of these corrections can be found at http://research.microsoft.com/en-us/projects/ten_billion/default.aspx)

(July 12th 2013. Second update. The page of corrections to Professor Emmott's book has now been taken down from the Microsoft website)

(August 23rd 2013. A list of corrections to some of the errors noted in this article has now been posted again at http://research.microsoft.com/en-us/people/semmott/tenbillionbookrevisions.pdf. Thanks to Richard Snape for pointing this out)

Stephen Emmott’s book on global ecological challenges is attracting much attention. The work is extremely short – perhaps about 15,000 words – and is in the form of notes that provide terse commentary on a series of graphs. It is little more than a Powerpoint presentation turned into a slim paperback. Although any attempt to increase mankind’s alarm at the threat from climate change is welcome, Emmott’s book is error-strewn, full of careless exaggeration and weak on basic science. Its reliance on random facts pulled from the internet is truly shocking and it will harm the cause of environmental protection. As might be expected, the best sceptic bloggers are already deconstructing its excesses line-by-line. 

Things are indeed pretty bad. The steps to address climate change are lamentably slow and ineffectual. Biodiversity is in sharp decline in some parts of the world. Water supplies are becoming tighter in many countries. The pressures on global forests are declining but still acute in some places. Air quality is appalling in big cities in Asia and quite bad in major Western capitals. But we don’t help solve these problems by exaggerating their seriousness and picking up gobbets of data from dodgy sources we found on the web

All of us see these difficult problems but most see them as soluble. Not so Stephen Emmott. In his eyes the world is hurtling towards disaster at ever-increasing speed. To him, every global issue is of ‘accelerating’ seriousness. At one point the word ‘accelerates’ is used 8 times in just over 100 words to describe a tip into some future hell.  (It’s also striking that a senior scientist uses this word inexactly. He generally doesn’t mean that the rate of change is increasing but merely that the particular phenomenon he is worried about is continuing to grow).

Emmott starts by looking at population from the year 10,000 BC. He says he uses data from the UN but I cannot find anything produced by this organisation that records estimates prior to 1950. He seems instead to have employed a file found on the internet at http://commons.wikimedia.org/wiki/File:Population_curve.svg. This file has the unusual features of Emmott’s first chart, such as the use of a year called ‘AD1’. He uses the curve of population growth to tell us we might see a fourfold increase in population by 2100.

Despite Emmott’s assertions to the contrary, population growth has been slowing steadily since the 1960’s. The number of people in the world is increasing by about 1% a year and the slowdown will almost certainly continue. This is never mentioned, let alone discussed by Emmott. Reasonable 2050 predictions are almost all in the 9 to 10 billion range, with most people seeing declines after that date but he tells us that we might actually see 28 billion by 2100. Does he have an argument why his number could be right? No, he just asserts it.

Similarly, he addresses food supply with passionate language and few facts. He ignores the relatively stable and gradual increases in food availability per person over the last half-century and predicts coming apocalypse.  A huge increase in land needed for food production is forecast, something completely unpredicted by any experts in the field. He reserves particular scorn for the impact of improved agricultural technologies such as pesticides and fertilisers. ‘The Green Revolution is a myth’ he writes, ignoring the extraordinary and reliable increase in food production launched by the plant breeder Norman Borlaug in India that made famine thankfully rare. His assessments of the need for more land on which to grow crops seem to crudely assume no increase whatsoever in yields per hectare, ignoring reliable evidence since the 1960s.

Very strangely, I don’t think any of of the thirteen apocalyptic charts in his book are taken from primary sources. The data he uses is almost always ‘adapted’ from other work, something which doesn’t appear to embarrass him. The figures employed aren’t traceable and checking is difficult.  But those charts that I was able to source are generally mis-drawn or downright misleading. For example, the worrying chart on species extinction on page 54 of the Kindle edition seems to present a sharp, abrupt and catastrophic rise from the year 2045 without any basis in fact or scientific research. Others are similarly invented.

When it comes to discussion of fish production, Emmott shows an equally disturbing lack of knowledge. He writes that a ‘fully exploited’ fishing ground has ‘no fish left’. Actually, the words mean that the rate of fish extraction cannot be increased without loss of long term fish extraction potential.

He’s also worried about water availability. And this is indeed going to be one of the world’s most pressing problems by 2050. But he exaggerates, as in so many other instances, the current seriousness of the issue. Several of his very sparsely filled pages are given over to discussing how much water is needed to grow food but nowhere does he discuss the global availability. Yes, the world does use 6,000 cubic kilometres of fresh water a year but we probably have about twenty times this much available in one form or another. Small improvements in irrigation practices will almost certainly help us decrease water stress in the most threatened global food production areas. I’m not trying to diminish the severity of the challenge but to ask Emmott to give us careful argument, not overplayed assertion.

Although I think that most of what he says on other subjects is ill-researched, most of the readers of this blog will agree strongly with his views on climate change. He exaggerates the likely increase in global energy need - a few well researched charts from the recent BP statistical review would have helped him - but we do face a real likelihood of a 4 degree temperature rise on current trends. Emmott is right to emphasise the weak global response to this threat.

He’s not a fan of renewable energy sources but his opinions are surprisingly casual. PV, for example, is flawed because ‘the production of the new generation of solar panels involves nitrogen triflouride (sic) – one of the most potent greenhouse gases on earth’. Nowhere does he tell us that this molecule has been used for years and that when calculations have been done, the carbon benefit of the renewable electricity generated by the panel dwarfs the global warming impact of the nitrogen trifluoride used. This is typical of the book: lots of strong assertions, no analysis and lots of factual mistakes.

In the end, his ambivalent feelings towards humanity come out all too clearly. Every which way you look at it, a planet of ten billion looks like a nightmare, he writes. I wanted him to come up with solutions to humanity’s problems, not to exhibit a troubling misanthropism and astonishingly careless use of data and basic science.

Appendix

There are scores and scores of errors and exaggerations in this short book. I’ve mentioned a few of them below to demonstrate the range of surprising misstatements.

(Page numbers refer to the Kindle edition)

Land grabs

Emmott writes (page 50)

During just the past twelve years, almost 50 million hectares of land have been traded. That is an area of land the size of half of western Europe being bought and sold

Depending on which countries you include, 50 million hectares of land is approximately equal to 15% of the land area of western Europe, not 50%. 50million hectares is less than size of France.

Keystone XL pipeline

Emmott says (page 76)

And Barack Obama has committed to extending the importation of tar sands oil from Alberta in Canada to the US through the development of the ‘Keystone XL’ project – providing US consumers with close to one million barrels of oil per day from Canadian tar sands.

President Obama has not committed to Keystone XL. This is how the LA Times reported his comments Tuesday June 25th 2013:

President Obama set a high bar for approval of the controversial Keystone XL pipeline, declaring for the first time that he would let the project go forward only if it does not “significantly increase” emissions of greenhouse gases.

UK oil and gas exploration

Emmott says (page 77)

In the UK, despite its stated commitment to tackling climate change, the British government issued 197 new licences to drill for oil and gas in the North Sea – the largest number since North Sea oil drilling began in 1964.

Emmott appears to be referring to the 2012 North Sea licensing round. His comments seem to have been taken from the Financial Times of October 25th 2012. The paper said

The government has issued 167 new oil and gas licences to companies seeking to drill in the North Sea, in what John Hayes, the energy minister, described as a “bonanza” for the oil industry.

The UK’s 27th licensing round for the North Sea attracted its greatest ever level of interest, with 224 applications – the largest number since offshore licensing began in 1964.

Emmott has made small but sloppy mistakes. The number of licences wasn’t 197, it was 167. The record was not of granted licences but the number of licence applications.

Melting of sea ice

a)      Emmott writes (page 108)

Arctic coastlines are retreating by 14 metres per year.

This statement seems to have originated in an Economist article of June 16th 2012 (‘The Melting North). The paper wrote

As their ancient ice buffers vanish, Arctic coastlines are eroding; parts of Alaska are receding at 14 metres (45 feet) a year.

Note that what the Economist said was parts of Alaska, not all Arctic coastlines. The average rate of recession is much, much slower. A 2011 article in Science Daily summarised the conventional view when it wrote (http://www.sciencedaily.com/releases/2011/04/110417185342.htm)

The coastline in Arctic regions reacts to climate change with increased erosion and retreats by half a metre per year on average.

Emmott exaggerates about thirty fold.

b)     Loss of Arctic and Greenland ice

Emmott says (page 108)

Greenland and Arctic ice sheets are now losing some 475 billion tonnes of mass per year into the sea. This is going to contribute to rising sea levels.

Prof Emmott appears to be confusing the Antarctic and the Arctic. The study he seems to be referring to was carried out by Eric Rignot and others (http://onlinelibrary.wiley.com/doi/10.1029/2011GL046583/full)  and refers to the loss of ice from the Antarctic and Greenland ice sheets. Arctic ice floats on water and when it melts it does not raise sea levels by a measurable amount.

Methane hydrates

Emmott writes

For the first time, hundreds of plumes of methane – many of them kilometres across – have been observed rising from previously frozen methane stores in the Laptev Sea, off the East Siberian Arctic shelf.

Once again, he doesn’t provide a source for this comment. However he seems to have used research work by Russian scientists from 2012. The Voice of Russia summarised their results as follows.( http://english.ruvr.ru/2012_09_18/Methane-emission-in-the-Arctic-a-possible-key-to-the-global-warming/)

Russian scientists have discovered more than 200 sources of methane emissions in the Arctic, particularly in the north of the Laptev Sea. Two of the methane fields exceed 1 kilometer in diameter, said Igor Semiletov, expedition head aboard the Viktor Buinitsky research vessel. Methane emissions in the Arctic have been observed before and are explained by bacterial activity.

The release of trapped methane from the world’s cold oceans is an extremely serious threat. But Emmott exaggerated the findings of the research, stating, for example, that ‘many’ of the plumes were kilometres across rather than the two mentioned by the researchers. He also incorrectly says that this is the first time the methane has been observed.

Demand for land for food

Emmott writes (page 118)

Yet demand for land for food is going to double – at least – by 2050, and triple – at least – by the end of this century.

Emmott elsewhere tells us that 40% of the world’s land area is used for agriculture (page 155), so it is difficult to see how the numbers above are remotely possible.

The Food and Agriculture Organisation (FAO) makes regular assessments of the need for arable land to grow food. Land needs are reduced by improving agricultural yields and increased by rising population and increasing space allocation to low productivity uses such as meat production and fruits. The latest assessment for 2030 and 2050 (http://www.fao.org/docrep/016/ap106e/ap106e.pdf) suggests that land use for crop production will rise by 70 million hectares to 2050 from a figure of about 1.6 million hectares today. This means the area under cultivation will increase by slightly less than 5%, not the 100%+ suggested by Emmott.

Food production

a)      Panic

Emmott writes (page 122)

We currently have no known means of being able to feed ten billion of us at our current rate of consumption and with our current agricultural system.

On the contrary, we understand well how to feed people. The current agricultural system has increased productivity for the last fifty years and that increase continues, albeit at a slowing rate.  Climate change will probably cause increasing variability of yield but Emmott’s assertion has no substance to back it up.

b)     Shortage of phosphates

Emmott asserts (page 129)

The amount of food we produce is almost entirely dependent upon phosphate-based fertilizers. But phosphate reserves are finite, and it is becoming apparent that we are going to run out of it, almost certainly some time this century.

The US Geological service estimates (http://minerals.usgs.gov/minerals/pubs/commodity/phosphate_rock/mcs-2013-phosp.pdf)  the usage rates of the key minerals and the amount of reserves still in the ground. In the case of phosphate rock it states that annual usage is about 210 million tonnes. World reserves are put at 67 billion tonnes, or enough for 300+ years at current rates. (In mature economies such as the UK demand for phosphates for farming is tending to fall).


A response to George Monbiot's pessimism on solar PV

(This is a guest post from Dr Mike Page of the University of Hertfordshire. Mike saw George Monbiot's article on the high costs of supporting solar power and wrote this note to him. I thought his letter was extremely interesting and asked if I could repost it here. Mike welcomes comments below this post or to m.2.page@herts.ac.uk. A video of his low energy house is here. Chris Goodall)
Thursday 27 June, 2013 :


Dear George, (if I may)

I write regarding your interesting piece about solar in the Guardian, 21st June, here . I think that you are mistaken in some of what you say, though I admit I’m less interested in the technicalities of who won your bet than in the more general case for and against UK solar. (I will play along with the bet bit, though, in what follows). I’m sorry that my comments are detailed and hence long, but I’ve been meaning to write to you about this before now, and your article yesterday has galvanized me. I should be very happy to discuss, or even debate, these points with you at any opportunity.

As an academic engineer turned psychologist, I have been working in recent years on designing and building energy-neutral micro-homes as part of the Cube Project (see the production model QB2 at this site and the original QB1 here). Given that one of the points of the original QB1, and of the production model QB2, was to demonstrate that a dwelling could, even in the southern part of the UK, generate as much energy as it uses (on average at least – more about that later), your points about solar are highly germane. The Cubes rely only solar energy, collected via 3kWp of solar panels and a 5kW air-source heat pump. Importantly, there is nothing about the Cube buildings that means that the same energy-neutrality could not be achieved with a full-sized home. Essentially, everything scales up with surface area and we have designed a four-bedroom house (QB7) along the same principles.

I turn to the details of your argument in approximately the order you raise them in your article, and have added some numbers (which were otherwise in somewhat short supply).

1. How much does UK solar cost and is it cost competitive? Have we got grid parity for householders?

I don’t really agree with your adoption of the DECC’s definition of grid parity (“Grid parity can be defined as the point at which government support for a technology is no longer required”) though I respect your attempt to get an independent arbitration. Even so, if I were being lawyerly (and I can’t resist) I would point out that you do not prove that a subsidy is required just by virtue of showing that a subsidy exists. As a psychologist, I’m well aware that a subsidy might be strategically necessary to get people to change their behaviour, even in circumstances in which it would be logical for them to change their behaviour anyway (i.e., in the absence of the subsidy). My attempt, therefore, will be to show that it is financially prudent for a householder to purchase UK solar today (and we are not yet at the end of 2013, when your bet expires). This, I guess, is in the spirit of your bet (whose terms were never agreed anyway, if I understand correctly).

Some figures: 4kWp of solar costs £6k-£7k today in the UK, all installed. (I know this, as we have just had a quote from a reputable supplier for a local project). Let us take £6.5k as representative. That 4kWp of panels will generate 3400kWh of electricity each year, local to the householder (i.e., consumer not wholesale), and will occupy around 28m2. I will use a lower figure of 3200kWh per year to take into account some loss over a 20-year lifespan. To raise £6500 and pay it back monthly over 20 years, at an interest rate of 5% APR (higher than current mortgage rates for that period), will cost me a constant £43 per month over the period, or £516 a year. This gives a constant cost over the period of (51600/3200)=16.1p/kWh, a figure that will remain the same regardless of any inflation in the economy over that period. Actually, in the first year, the price per kWh should be perhaps be based on the 3400kWh that will be generated in that year, which would give 15.2p/kWh inflating by no more, probably less, than 1% thereafter as the PV degrades slightly. I am not counting any energy that will be generated by the solar PV after 20 years though, if I did so, it would make solar look better still.

(Of course, the p/kWh figures here assume that I can benefit from all the energy that my PV system generates, as it generates it. Net metering (but no subsidy) would ensure that this is the case, and would allow any excess that I generate to be used by my neighbours. See below, for a discussion of what happens when lots of people have solar.)

How competitive is this? A quick trawl of comparison sites shows that if I were to choose an electricity tariff which fixes prices until only 2016 (not the fix until 2033 that I get with the solar option), then I would pay £530 per year for my 3200kWh. (OK, this includes some element of standing charge but, even without that, we are in the region of 14p/kWh today if you want to fix). So the price today of fixed-price electricity for the next two years is almost exactly the same as the constant price of solar for the next 20 years. You can be sure that the grid price will inflate after the fixed-rate period. Even it inflated by only 2.5% per year (it is unlikely, historically, that the rate of inflation would be so low) in year 20 the price would be 60% higher than the solar cost and the average cost over the whole 20-year period will have been 28% higher than the solar cost.

In summary, solar in the UK is already price competitive with grid electricity supplied to the household, even before any externalities in the grid electricity are taken into account. Any reasonable factoring in of the damage done by CO2(such as you would support) would, of course, push the grid price yet higher relative to the solar. The FIT subsidy is there to encourage behaviour change, not to make the electricity price competitive.

I’ve discussed above the issue of cost competitiveness of UK residential solar against consumer electricity supplied by the grid. I’m less sure that industrial PV in the UK is yet competitive with more traditional generating technologies as a supplier of wholesale electricity (compared on the basis of, say, the Levelized Cost of Energy, LCOE). However, the cost of PV is falling, whereas most of the alternatives are rising in cost (and, in the case of fossil fuels, will continue to do so as the price of carbon dioxide emissions is properly incorporated). Thanks to these drastic price falls, Chris Goodall, among others, now believes that PV in the south of England to be LCOE competitive with new nuclear as he writes here. Indeed, using a wholesale price of £1000/kWp, a discount rate of 3.5% over 20 years, and a capacity factor of 10% suitable for the southern UK, gives a LCOE of 9p/kWh (even disregarding any generation beyond 20 years). So Goodall may well be right.

2. Alternative low-carbon energy

You favour nuclear and offshore wind in your generating mix. I absolutely agree with you on both counts and, furthermore, support your position on 4th generation reactors such as the GE PRISM integral fast breeder reactor. Your support for both, however, must acknowledge that they will both lead to an increase in wholesale and, hence, consumer price. Even in their current negotiations for more conventional reactors, EDF are likely to get a strike price of 10p/kWh linked to inflation, possibly more. This is around 5p/kWh more than the current wholesale nuclear price, suggesting that the consumer price would rise by at least this much if new nuclear were to go ahead (as I hope it does). This would make solar even more competitive than I have set out above (especially since solar prices are likely to fall rather than rise, tariff disputes notwithstanding). Regards offshore wind, current wholesale prices seem to be around 14p/kWh, with a hope, rather than an expectation, that they will come down to 10p/kWh in due course. Such values would also suggest a consumer price per kWh of electricity significantly higher than today’s, and therefore not competitive with local solar or even wholesale solar. In summary, it is illogical to support offshore wind and nuclear on the basis of their price relative to UK solar.

3. Energy density and accessibility

One of points that I have seen you make several times before is that solar does not work well at high latitudes such as in the UK, while asserting that offshore wind is a good alternative. Some figures are necessary, I think. Based on the figures for the southern half of the UK given above, the energy intensity of UK solar is around 850kWh/(8760h*7m2)=13.9 W/m2. By comparison, the first phase of the London Array offshore wind farm is 100km2 in area and will generate somewhat less than 200MW at an average of less than 2W/m2. This is one seventh of the surface energy intensity of UK solar. Figures for onshore wind are similar. Don’t get me wrong: I support onshore and offshore wind, but the comparison in terms of surface energy intensity strongly favours solar, even at UK latitudes. In addition, as you point out, solar can be deployed very easily, discretely and quietly by comparison with either wind option. Moreover, as you also aver, a solar installation is also something that I can personally effect. I cannot personally insist that a government permits, and a company builds, a nuclear power station (though I wish that they would do both). I cannot personally construct an efficient wind farm (since efficiency demands massive scale). I can, however, deploy solar on my own roof, or contribute to a local community scheme. Solar is thus convenient and accessible.

4. Matching demand and energy storage

You point out that solar energy in the UK is not well matched to demand. I think, however, that this is an incidence of what, in a psychotherapeutic context, might be called all-or-nothing thinking. Clearly the UK could not run on 100% solar, as it could not run on 100% wind, but that is not really the issue. The issue is whether solar can make a good contribution to UK low-carbon energy mix.

The electricity demand on an average June day ranges from 23GW to around 37GW at midday (not, in fact, in the evening, and well synchronised, therefore, with the solar supply curve). In December the range is from 28GW to 48GW, the latter being in the early evening as you suggest. These figures mean that there would be no problem in excessive solar supply, were we to install, say, 30GWp of solar capacity (as in Germany). This could be increased if there were additional demand produced by a shift to electric vehicles, as I guess you would support. (Each million vehicles on a 7kW charge will provide a somewhat despatchable demand of 7GW, so five million such vehicles can double our summer peak demand so as to absorb solar peaks.) 30GWp of UK solar would produce around 26TWh of very low-carbon electricity per year, which is 7% of current total UK demand. With reduction in night-time baseline power demand and by further managing daytime demand (charging EVs, generating hot water using heat pumps, etc., at any excessive solar peaks), there is no reason why solar could not contribute nearer 20% of yearly electricity demand without the need for any other storage.

As Chris Goodall has pointed out in his comments on your piece, there are also possible peak storage mechanisms other than EVs and hot water. He suggests power-to-gas, which converts electricity, water and CO2 into methane at around 55% efficiency, possibly rising to 75% in future. Even at 75% electric-to-gas efficiency, the round-trip electricity-to-electricity efficiency would be no more than 40% if reconversion to electricity was required. An alternative is storage of electricity in the form of liquid air (e.g., UK company Highview Power Storage) which already achieves 60% and is intended to reach a 70% round-trip electrical storage efficiency (approaching that of pumped water storage) if placed in locations next to a source of waste heat (such as a nuclear power station – you’ll see where I’m going here). This 70% of stored electricity could, of course, be used to run a heat pump when it returns to the grid, making a substantially more efficient system overall than electricity-to-gas (though with legitimate questions about storage capacity).

In summary, there is not an immediate problem in terms of demand matching until one gets to at least 10% overall solar supply and, with additional storage in EVs, hot water and cryogenic stores, this figure might rise to nearer 20%. Even in June, solar peaks don’t need to be stored for very long, as energy demand continues into the evening and throughout the night.

To conclude, whatever the state of your excellent bet with Jeremy Leggett (and I gather that he is expecting to concede, prematurely perhaps), I think you have sold UK solar somewhat short, not so much shooting in the air as shooting yourself (and the rest of us) in the foot. I’d be most interested in your comments, or to discuss this at any time at your convenience.

Statistics so strange you don’t notice them at first

Green Deal assessors have visited ten thousand homes and written down recommendations for saving money on energy bills. Out of this group, 195 householders  were told to install a roof-mounted wind turbine.  This is really, really surprising – not least because these turbines have fared so catastrophically badly on domestic properties. But there are three other concerns as well. One, no-one should ever lightly recommend a roof mounted wind turbine on a domestic property. The turbulence around the roof will usually reduce the output of a turbine to minimal levels. Even in the tiny number of exposed locations where a roof turbine might just work properly, the householder would need to take at least three months of wind speed measurements before risking purchase. The quick inspection by the Green Deal assessor isn’t nearly good enough.

Second, there is virtually no prospect of roof mounted wind turbines meeting the Green Deal’s Golden Rule of cutting energy bills after financing costs. The scheme rules say that therefore they shouldn’t be recommended. The best available roof turbine is the Swift, a 1.5 kW machine costing about £7,000 including an allowance for installation. This might produce 2,500 kilowatt hours a year in the very best location, with a FiT income, including exports, of less than £600. Energy bill savings could add another £150. With Green Deal interest rates of 7% and an annual maintenance charge of perhaps £100, the turbine won’t have covered its cost by the end of a 20 year life. The homeowner would lose money.

Third, if the home really is in an area with very good and steady winds (which must mean the building is on a coast with no trees nearby and clear access to the south west), the right recommendation might be to install a pole mounted small conventional turbine. But, very curiously, none at all of the Green Deal’s first 10,000 households at all were given this advice.

It all seems very strange. The suspicion must be that the assessors for the 195 properties were simply unaware of the sad record of roof mounted turbines in the UK and how wildly inappropriate they would be almost everywhere. This should increase concerns that they the Green Deal assessors are not appropriately trained for the difficult task they are carrying out.

DECC gives high guaranteed prices for large scale renewables. But the total amount of money available is unchanged.

Energy announcement piled upon announcement today. Alongside the expected news that zero (that’s a nought with a large number of noughts after it) households had completed the process of getting a Green Deal loan, DECC announced financial support for nuclear funding and, once again, denied this support was a 'subsidy'. More interestingly, it also unexpectedly gave us the proposed new guaranteed prices for electricity delivered from large scale renewables. The biggest surprise, not yet noticed by commentators, was that these prices are higher, in some cases substantially so, than current ROC or Feed In Tariff rates. Without flagging it too obviously, DECC has won more short-term support for renewables. Is this good news for the industry? Yes and no. The scramble to build new PV and wind farms to capture the early years of the new rates will bring rapid expansion from April 2014 onwards. But this surge in investment will mean that the available funds will be rapidly exhausted and we’ll see another collapse in renewable investment sometime in 2015. Cynics will notice that the next General Election will occur in May 2015. The Coalition parties will be able to trumpet the burgeoning wind and other renewable industries only for the money to dry up when the new government is installed.

The table below lists my estimate of the revenues to be gained under the Feed In Tariff or ROCs for the main renewable technologies. The FIT rates are for this year, the ROC calculations (for which we already know the banding decisions) are for 2014/15. I've also estimate the revenue from the sale of the power. The last row shows the new guaranteed rates for 2014/15. (These rates are called Contracts for Difference, or CfDs)

Offshore

Onshore

PV

Hydro

AD

FIT 2013/14

-

£86

£113

£77

£137

(Size band for FIT)

(1.5-5MW)

(5mw+)

(2-5MW)

(500kw+)

 
ROC 2014/15

£135

£85

£108

£77

£135

CfD 2014/15

£155

£100

£125

£95

£145


(Key assumptions. A ROC is worth £45. The typical power purchase agreement for an intermittent renewable is also (by coincidence) worth £45 per MWh.  Please send me corrections if you think these assumptions are wrong. AD is anaerobic digestion)

Payments made under CfDs will therefore be as much as 15% higher than under the ROC scheme. In the case of large PV projects this means that the owner will get a guaranteed £125 per megawatt hour, linked to the CPI for 15 years. The ROC scheme provides returns for longer (20 years) but the price fluctuates and isn't necessarily inflated by consumer price increases. If I’ve done the numbers correctly, the generous people at the Treasury have just made PV developers even keener to get their projects on the ground in Cornwall.

Strikingly, it’s not just 2014/15 prices that are better but the greater support persists into future years. For example, a PV farm installed in 2014/15 gets £125/MWh falling to £115 pounds in 2016/17. But the revenue from ROCs and power sales would be cut to £99 by that time. More importantly, offshore gets better protection as well with the proposed new rates. The income will be £20 better per MWh in 2014/15 but £24 greater than ROCs in 2016/17.

The problem is that the subsidiy cap is still going to be £7bn in 2020. So the increased rates proposed today will more quickly exhaust the available funds (meaning the door will be shut to new projects sooner) and the total amount of capacity installed will be slightly smaller (because payments per megawatt hour are greater).


People who have stakes in wind farms don't object to the noise.

The UK needs more onshore wind farms to meet emissions targets. Wind turbines on land currently provide the lowest cost low carbon electricity. A five fold expansion is envisaged by 2030, taking the UK to about the same geographic density of turbines as Germany today. Widespread and determined opposition from a substantial minority of UK citizens will slow, or even stop, the growth of wind. Recent government proposals to increase the payments by wind developers to communities affected by the developments are not enough. If you think turbines are noisy and ugly, your views will not be changed by a few free solar panels on the school roof.

There is only one route forward. Local people must be given shares in the wind farm, giving a measurable and significant stake in the development. Why? First, of course, because their views and their standard of living are affected by the development and they deserve recompense. Second, because people who own stakes in wind farms have different attitudes towards the turbines on their doorstep. For example, they aren't annoyed by noise. They hear the turbines as much or as little as others; they just don’t mind.

Many studies, particularly in Europe, have shown the real and substantial effect of wind turbine noise on local people. Wind is generally regarded as worse than industrial or traffic noise at the same measured volume. Some people are annoyed by wind turbines at noise levels equivalent to those typically found in a public library. (about 40 db. Source: Argonne National Laboratory)

Rather than deny the problem, wind advocates need to find ways of dealing with it. Luckily, research shows an easy route: give people a financial stake in the wind farm.

This is a chart from a widely quoted 2009 paper (1).

Objections to wind turbines

 (The stars on the right hand chart indicate measures of statistical significance)

It compares two groups of Dutch people, totalling over 700 people. The larger sample contains individuals that do not benefit financially from local wind farms. The much smaller group only includes those with a personal stake in their success.

The graph on the left records the percentage of each sample that could hear the turbines near to them. As might be expected, the number rose as the intensity of the noise increased. At levels between 35 and 40 decibels, the number able to hear was about 80% and this didn’t vary very much between those with a holding in the wind farm and those without.

When it comes to being annoyed by the noise, the pattern is very different. For example, 20% of people without a stake were upset at noise levels between 35 and 40 db (that is, below the ambient level of a public library) but none of the shareholder group. Current noise recommendations in the UK suggest a maximum level of 43 db. (2) This noise is heard by almost everybody, annoys 25% or so of non-shareholders but a tiny percentage of stakeholders. (Overall only 3% of the shareholder group were annoyed by any wind disturbance).

A reasonable implication is that giving people individual stakes in a wind farm will reduce the volume of noise objections to close to zero if regulations are adhered to. But what about those who simply dislike the appearance of turbines? Most studies show a very close correlation between disliking the appearance of a wind turbine and being annoyed by the noise. The connection of causality isn’t clear: it could be that dislike of appearance drives a hatred of noise or it could be the reverse. If it is noise that is the cause of opposition to wind, then giving affected people a stake of a few thousand pounds, and more if the noise levels are high, is going to dissipate much of the antagonism. Rather than offering token community payments, wind developers need to find a way to give their neighbours reasonable stakes in the success of the wind farm that has changed the appearance of their landscape.


1, Pedersen E, van den Berg F, Bakker R & Bouma J. (2009): Response to noise from modern wind farms in the Netherlands. The Journal of the Acoustical Society of America, 126(2): 634-43. (Paywall)

2, And, in a little noticed part of the recommendations, these figures can be slightly higher if the affected persons have a stake in the development. Very sensible but ignored.


Look carefully and you can see solar PV output denting UK electricity demand

When the sun is shining, solar PV on roofs cuts apparent electricity demand and reduces the call on conventional generating stations. Can we see the effect in the national figures for power need? Yes, it seems we can. The last few days have been sunny so I compared electricity demand this year with a comparable period in June last year when it was very dull indeed. Overall, power use is down slightly but apparent demand in the sunniest bit of the day is strikingly below the average for last year. The 2.5 gigawatts or so of PV on roofs and in fields appears to be having an observable effect on the need for daytime electricity production. I compared the seven days from 31st May to June 6th with the period of 20th June to 26th June 2012. You’d expect electricity demand to be roughly comparable in these two periods. Average generation in 2012 was about 32.8 gigawatts and about 3% lower in 2013. But the daily pattern of generation varies substantially between the two different weeks. Nighttime demand was slightly higher in 2013 while  daytime requirements on the grid were almost 2 gigawatts lower.

Chart 1

UK generation june

Source: Elexon

The chart below expresses this simply as the difference between the two years. A negative figures means demand in 2013 was lower than in 2012.

Chart 2

uk pV4

Source: Elexon.

It’s plausible that the prime cause of this daytime demand drop is the three hundred thousand or so domestic and factory roofs providing most or all of the electricity to the building. The daily period over which the demand reduction is seen is slightly later than I would have guessed. Lower demand starts at around 8 am but continues until 9 or 9.30 pm, when the sun is almost set.

Forecast German solar production today (7th June) has a slightly different pattern. (‘Solar time’ in central Germany is about 30 minutes in front of us: the clocks are an hour in front but the sun rises somewhat earlier because Germany is east of the UK). It has died down by around 8 pm. These figures are the reverse of the UK in that they express PV as a positive addition to electricity output rather than as a reduction in demand. Nevertheless the broad picture is the same as in chart 2.

Chart 3

German PV

Source: EEX Transparency Platform

I’d hesitate before saying that we can definitely  see the impact of PV on UK demand but it’s a reasonable hypothesis that summer daytime electricity production on sunny days is being depressed by up to 2 GW –  5-6% of total demand.


Solar will get to grid parity in the US within four years

Energy policy day at Oxford University last Friday – many senior industry, academic and government people on the panels. Speaker after speaker ignored solar because ‘PV is too expensive’. Charts appeared on the large screen in the lecture theatre with PV sitting at about £250 a megawatt hour, or about seven times the current wholesale price for electricity. People really ought to read the newspapers: PV costs have fallen vertiginously for years. Solar isn’t yet competitive with coal in the UK but it isn’t far off.

In the US, the position is even more favourable for solar. Here’s what Neal Dikeman, a leading US cleantech venture capitalist, wrote today:

First Solar announced a $0.99 cent/Wp target within 4 years for installed with trackers utility scale in its investor deck.  That equates to around $4-5 henry hub gas price in a new combined cycle gas plant.

The scary thing is that best utility scale PV solar is already approaching the $1.50/Wp range in the LAST quarter, equating to $7-8 Henry Hub.

The Top 5 PV manufacturers announced module costs all south of $0.65/Wp.  First Solar says <$0.40/Wp in 4 years. Greentech Media says the best Chinese C-Si plants will do $0.42 within 3 years.  Screw the EU and US dumping  trade wars.  That my friends, is grid parity for a massive swath of the electricity market wholesale AND retail.

These companies are learning to work on GP margins of sub 10%.  They are getting lean, and mean and good

(A few notes: Wp is peak watt. This is usually expressed in Europe just as watts. Henry Hub is the US gas exchange. Last week’s prices (late May 2013) were about $4.20. US wholesale electricity prices are far lower than in the UK and Europe: current Texas prices are about $42 or £28 per MWh. Large UK solar fields are already at $1.50 a watt. So solar in the UK, which achieves about two thirds the output of a plant in the southern US will be competitive with grid power at the same time or before.)

The most disruptive effect of UK solar will be the marked dip in midday electricity demand between 10 and 2 as panels on factories and warehouses achieve peak production. The UK grid is used to fairly flat summer demand at these times. This isn’t going to be the case for much longer as building owners wake up to the increasingly obvious fact that PV saves you money. UK policy makers need to wake up to the impact of even lower PV prices than today rather than making comments about solar that are two years out of date.


Mixing renewables and back-up gas power is going to be wasteful

The purpose of this draft paper is to assess what will happen if, as expected, many gigawatts of  intermittent renewables are added to the UK grid alongside large amounts of standby gas power. I use actual data from spring 2013 to model what will happen in 2030 if the expected portfolio of low carbon sources of electricity is constructed. In particular, I try to estimate how much the back-up gas plants will be used and how much surplus and unusable electricity will be generated when the wind is blowing strongly or demand is relatively low. I suggest that the two principal issues facing the UK grid will be using the huge seasonal surpluses of electricity arising in late spring, summer and early autumn and, second, how to finance the construction of tens of gigawatts of standby power which may be used less than 10% of the time.

I conclude by tentatively putting forward a view that the right way to deal with these issues may possibly be to invest even more heavily in renewables (and less in gas standby) and use the increased surpluses to produce methane for use in the gas grid. This may be a cheaper and more energy-secure solution than current proposals. It will also make decarbonisation of heat easier than currently expected.

(As always, I'm very grateful for comments on this article, however critical.)

Electricity demand and supply in 2030

Electricity supply.

a)      Generation portfolio. With adjustments, I use the latest figures from the Committee on Climate Change (CCC). [1] The CCC says that ‘decarbonisation of the power sector is key to reducing emissions across the economy and would also enhance energy security’. It proposes four broadly similar scenarios that enable the UK to cut emissions from electricity generation to below 50 grams of CO2 per kilowatt hour. All these scenarios involve large amounts of nuclear power, wind generation, biomass burning, electricity production from fossil fuels using carbon capture and storage and unabated generation from conventional combined cycle gas plants (CCGT).  I have merged these four possible future plans into a single estimate but simplified it to only include nuclear, wind, CCS, biomass, unabated gas and solar PV.[2]

The figures in table 1 are based on the following key assumptions

a)      Nuclear. The government reaches agreement with the power and construction companies over the price that will be paid for electricity produced by nuclear power stations. As a result, two or three consortia built about 8 power stations by 2030.[3]

b)      CCS. The government must also reach agreement over the price paid for power from CCS-equipped fossil fuel plants. As important, experiments and pre-commercial deployments need to happen quite quickly, if large plants are to be ready by 2030.

c)       Wind. Offshore and onshore farms are projected to both contribute about 25 GW of capacity. The key issue is whether offshore wind costs decline at the rate expected by the CCC.

d)      Biomass. Electricity generation from burning biomass is included in the government’s plans for 2020 and financial incentives are provided. I have assumed no expansion of biomass beyond the CCC’s figure for 2020.

e)      CCGT. For the UK to have security of electricity supply, it needs to have enough ‘dispatchable’ generation capacity to meet peak winter needs. At the moment of likely maximum power requirements in early evenings in December and January, no PV is available and wind output may be negligible. So CCGT and nuclear, biomass and CCGT must cover the total requirement. In the last few years, the peak has been about 60 GW and I have suggested a figure of 40 GW of gas-fired power generation, leaving 20 GW to be provided by the other reliable power sources and a 5 GW safety margin. The CCC’s scenarios range between 40 GW and 46 GW.

Table 1

Central scenario for 2030 – generation capacity

Nuclear 12 gigawatts (GW)
CCS 11 GW
Wind 50 GW
Biomass 4 GW
CCGT 40 GW
Solar PV 10 GW
Total 127 GW

Electricity demand

In recent years electricity use has been gently falling. This change has been caused by improved energy efficiency and a weak economy. In addition, higher electricity prices have choked off demand.

The CCC assumes that electricity generation will rise from about 350 terawatt hours (TWh) in 2011 to between 403 and 465 TWh in 2030, an increase of between about 15 and 30 percent. The Committee isn’t clear in its most recent report why this increase will happen but previous publications from the CCC have pointed to the likelihood of increased electricity use from the use of heat pumps for domestic heating and from growth in the number of electric cars.

Other sources are less bullish about power demand. (Electricity demand is lower than electricity generation because of losses in the distribution system and use of electricity by the generators themselves). The most recent work by the National Grid suggests lower figures than those projected by the CCC.[4] National Grid’s three scenarios offer estimates of 2030 electricity demand that vary from a figure very similar to today’s level in its ‘Slow Progression’ scenario to estimates about 10% higher in its Gone Green forecast and 20% higher in the ‘Accelerated Growth’ view.

Projections for 2030

In the following section, I have estimated how much electricity is generated by the portfolio of generating plant in Table 1 during a portion of 2030. My approach was to assume that the daily pattern of spring demand in 2030 – rising from about 5 am to a plateau from 9am to 7pm and then falling sharply – is identical to 2013.

Figure 1 shows how electricity production varied for each of 4,300 half hour periods from February 23rd to May 23rd.

Figure 1

Electricity production, including imports, for half hour periods, expressed in megawatts

 Total electricity demand

The chart shows the expected daily variation with production rising to a peak at the end of the working day/beginning of the evening and then falling to a much lower nighttime level. It also exhibits the weekly cycle of lower weekend and Bank Holiday power needs. Average demand levels were highest during March 2013 because of the unusually cold weather, peaking consistently at over 50,000 megawatts (50 GW).  By May, peak demands averaged around 40 GW, with nightime levels falling to around 25 GW, down from 30-35 GW in March.

The next step was to estimate the source of electricity by type of generator in 2030.  I have done this in the following way.

a)      I used the 3 months electricity production data from late February to late May 2013. The manager of UK electricity trading arrangements, Elexon, publishes data for each half hour period. This information includes data on how much power is produced by nuclear, wind and all other types of generator.[5]

b)      This 3 months of data provides estimates of the total amount of electricity generated by wind power in each half hour. For this 3 month period, the capacity of wind connected to the UK National Grid was 7.15 GW. The estimate in Table 1 is that this will rise to 50 GW by 2030. Therefore if the weather patterns in spring 2030 were to exactly the same as in spring 2013 we can plausibly assume that seven times as power will be generated. (7.15 GW multiplied by 7 equals about 50 GW, the assumption in Table 1 for the amount of wind capacity in 2030).

c)       Nuclear power stations will operate continuously although some portion of capacity may be unavailable because of maintenance. I assume that 10 GW work continuously during the 2030 spring period.

d)      CCS plants will also be working continuously. This is because they will be paid a standard and unchanging contract price for electricity. It will therefore make financial sense to operate them all the time.

e)      The same is true for the 4 GW of biomass capacity.

f)       I have assumed a standard daily profile for PV production, starting at daybreak and rising to midday and falling as the afternoon proceeds. This profile varies only by the month of operation with May output being much higher than production in late February. Average daily output figures for each month per kW of installed capacity are taken from records of a small rooftop PV installation.

g)      Imports of electricity: in spring 2013, the UK imported significant quantities of power from France and the Netherlands. The 2030 forecasts assume no net imports. (This assumption is relaxed later in this paper).

To summarise: I have taken actual 2013 electricity generation for each half hour in a three month spring period and then used the predicted portfolio of generating capacity in 2030 to show the makeup of electricity production in that year. Nuclear, CCS and biomass plants (totalling an available figure of 25 GW, slightly less than maximum capacity because some plants will be undergoing maintenance) work continuously in 2030. Production from wind turbines is seven times greater than the 2013 actual figures for wind generation. Solar PV generates electricity during the daytimes according to a set pattern. CCGT plants operate when the amount of wind and PV generation would be insufficient to bridge the gap between the dispatchable power sources (nuclear, CCS and biomass) and the total 2013 demand levels.

The results

Overall

25 GW of generating plant that is working continuously will generate almost enough power to cover the minimum needs of a night in late spring. By contrast, peak demands of 55 GW in the early evening of the last days of February will require either substantial wind-generated electricity or the use of some of the 40 GW of CCGT plants.

When the wind is blowing strongly, the UK is likely to have a substantial surplus of power. By contrast, quiet days will mean continuous use of gas-fired generation.

In the three months under study, UK generators attached to the main distribution network and adding in imports produced about 81.2 terawatt hours (TWh) of electricity (or 81,200 gigawatt hours). In 2030, the portfolio of predicted generating plant working under the same conditions would produce 94.5 terawatt hours. This would be made up as follows

Table 2

Makeup of spring 2030 electricity production if demand conditions and wind speeds the same as 2013

Nuclear 23.6 TWh
Wind 32.0 TWh
CCS 21.5 TWh
PV 2.4 TWh
Biomass 8.6 TWh
Total before CCGT 88.1 TWh
CCGT 6.4 TWh
Total including CCGT 94.5 TWh
Surplus over electricity generation need 13.4  TWh (about 16%)


This is the key result: with the portfolio identified by the CCC, and the same demand pattern in 2030 as in spring 2013, CCGT plants need to generate 6.4 TWh and, second, the variability of wind means that the UK nevertheless produces 13.4 TWh too much electricity. This surplus must be exported, stored or dumped because electricity demand must match electricity supply every minute of every year. Figure 2 shows when the UK is in surplus, and by how much, over the 4,300 half hour periods under study.

Figure 2

UK net electricity surplus (-ve) or deficit (+ve) before taking in account the use of CCGT plants, expressed in megawatts

 Surplus


Several features of this chart stand out.

a)      As winter ends, surpluses of electricity become more common. From mid-April onwards, periods of deficit, and hence need to back up intermittent wind using CCGT, become much more rare.

b)      Surpluses and deficits can be very large in any one period. Deficits peaked during March at levels over 20 GW. But deficits of this size tend to be very short-lived. The peak deficit of around 25 GW at point 903 was followed 5 hours later by a need for only 8 GW of back-up gas generation.

c)       Surpluses in the coldest months (such as around points 700 and 1400) are driven by major storms. These events last for several days and can produce sustained and very large surpluses. The importance of these sustained surpluses will be discussed later.

d)      The April/May surpluses are only interrupted by very short periods of need for CCGT back-up. The implications of this will also be mentioned in the section on storage.

Demand for gas generation

One criticism of the approach in this paper is to say that the CCC assumed higher overall electricity demand in 2030. (In future work I will examine the implications of greater aggregate demand). The calculations here suggest that 40 GW of CCGT back-up will only  provide about 6.4 terawatt hours of power in the late February – late March 2030 season. This is equal to only 7.5% of potential output. The CCC itself admits that the gas back-up stations will be used for ‘less than 20%’ of their capacity.[6]

An important question is whether the late February/late May 2013 electricity generation figures are reasonably typical. Multiplied up to the entire year, the figures under study suggest a total electricity generation of about 330 terawatt hours, just less than a quarter of actual total annual need for this year. In other words, the period I used has average daily electricity needs of very slightly below the mean for the year. But the variance is only about 5% and would not significantly affect the results in this paper: the total yearly demand for gas back-up generation will probably mean that CCGT plants stand idle for a very large portion of the time.

The CCC estimates that CCGT stations cost about £600 per kilowatt of power. The public policy question is therefore whether 40 GW of back-up stations are worth the £24bn that they are likely to cost (and for which electricity users will have to pay). If the late February/late May 2013 period is typical, these power stations will only provide about 8% of the total electricity production of the UK in 2030.

Storage

Swings in wind power production and variations in daily demand mean that electricity storage will become increasingly important. However, the results of my analysis suggest that conventional energy storage technologies are not particularly helpful in assisting management of electricity deficit and surplus. The reason? Periods of surplus, usually created by windy periods of a couple of days, generate far more electricity than could conceivably be stored using conventional technologies.

To validate this last assertion, I modelled the addition of 50 gigawatt hours of storage to the electricity network. The current storage capacity for UK electricity, almost entirely in the form of hydro-electric power plants that pump water to a high reservoir when demand is low and let it flow downhill when electricity is scarce, is only about 10 gigawatt hours. 50 GWh is a five times expansion of this capacity, which will also be created largely from new ‘pumped storage’ reservoirs, principally in the Scottish Highlands.[7] But even 50 GWh makes very little difference, particularly when the UK in 2030 will often have days or weeks of consistent surplus in the warmer, lighter six months of the year.

My simple model suggests that the periods of electricity surplus in the three months under study created a total excess of around 13.4 terawatt hours. Less than 10% of that (1.1 TWh) could be stored and regenerated as electricity during times of deficit in the hours and  days after the surplus was created.

Even huge scale expansion of conventional storage, costing billions of pounds, doesn’t solve the fundamental problem that electricity surpluses and deficits will not principally be diurnal, balancing out during the course of day, but multi-day (in the case of typical Atlantic storms in winter) or, more importantly, seasonal. With the pattern of electricity generation capacity proposed by the CCC, the UK will be in deficit in winter and in sustained surplus during the summer. 50 GWh is about 6% of the average daily electricity demand of the UK and therefore incapable of being a significant contributor to electricity supply. To put this more vividly, mid-April 2013 saw consistent winds that would have resulted in a total surplus of 4.0 TWh over a five day period (more than 1% of total UK annual electricity need). 50 GWh (0.05 TWh) of storage reservoirs would have reused little more than 1% of this.

Exporting the surplus

Instead of storing the electricity abundance during windy weather, the UK could export the surplus to countries linked to the National Grid through interconnectors. (At the moment, the UK is typically a net importer of power from France and other places).  Interconnectors have a limited capacity to take current. Presently, the links to France, Netherlands and Ireland have a total size of about 3 GW.

I modelled creating export capacity of 5 GW, 8 GW and 10 GW for surplus UK electricity. I did this by looking at each half hour period in the three month study period and when there was a surplus calculating whether it could be carried abroad on interconnectors of the three sizes. The results are in the table below.

Table 3

How much of the 13.4 TWh hour surpus in late February/late May could be exported?

Interconnector capacity 5 GW 8 GW 10 GW
 
Exported 5.2 TWh 7.5 TWh 8.9 TWh
Remaining surplus 8.2 TWh 5.8 TWh 4.5 TWh
 
Total surplus 13.4 TWh 13.4 TWh 13.4 TWh


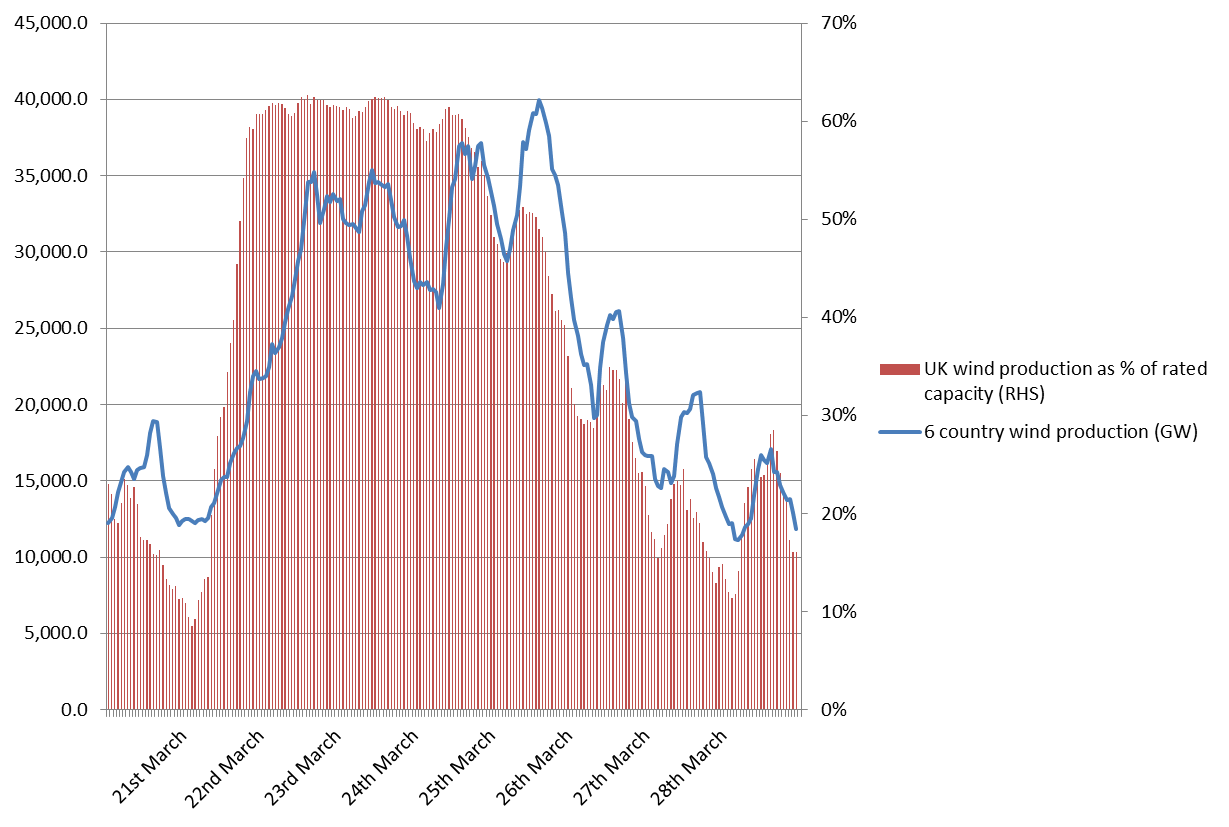
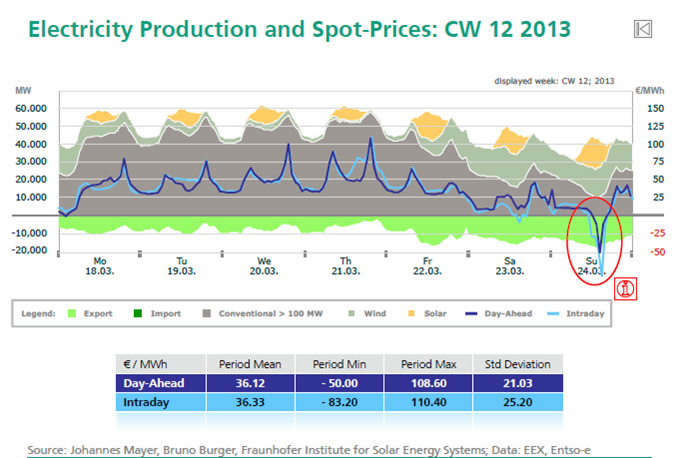
This analysis shows that a 10 GW interconnector could accept about two thirds of the surplus generated in the three month period. Even a 5 GW interconnector would be able to export over 40% of the excess. The problem remains that when the UK is in surplus, the rest of Europe probably will be as well. High winds over the British Isles will mean excess in other countries close to the UK. As an illustration of this, we can look at the point of maximum wind power in the UK in the three month period under investigation. At around 3.30pm on 22nd March, turbines were delivering 5.3 GW to the electricity grid. In Germany, the peak was at almost the same time.[8]  On that occasion Spain saw a daily peak of 12 GW an hour earlier than the UK.[9]

At times when the UK has surplus electricity, the rest of Europe – also heavily and increasingly reliant on wind power – will generally also be wishing to export. Although it may be possible to transmit the excess, the price of wholesale electricity will fall to zero or below. (Electricity can trade for negative prices if producers are paid for their production through subsidies such as feed in tariffs). Building bigger and bigger interconnectors to other European countries is not the solution to the oversupply problem.

The conclusions of this paper

This paper uses actual data from spring 2013 and modified CCC forecasts for the portfolio of generating plants to project the pattern of electricity demand and supply in 2030. It shows that the requirement that electricity demand is always met implies that the UK will have to have up to 40 GW of standby CCGT plants. If the UK acquires 50 GW of wind power (a seven fold increase on today but the CCC regards the figure as achievable) then the average gas plant will be used about 10% of the time. Expensive assets will lie unused for months on end but will have to be paid for by electricity users.

As importantly, a strong portfolio of nuclear and CCS plants will mean that baseload needs are met at periods of very low demand, such as summer weekends. 50 GW of wind power will mean about 40% of electricity demand is met from wind but much of this electricity will be – in effect – wasted because it cannot be stored and exports will have no value.

If the weather conditions of 2013 are replicated in 2030, the three month period of late February to late May will result in a surplus of about 13.4 TWh in the period. Extrapolation to a full year is difficult but might be as much as 40-50 TWh, or perhaps 15% of total electricity demand.

The following question arises. The CCC says that by 2030 all low carbon technologies, including CCS (and unabated gas) will be (very roughly) at the same cost.[10] Is the rational national strategy to choose 50 GW and some PV and expect substantial amounts of dumped electricity? Or will it be better to invest in ‘Power to Gas’ the only conceivable way of storing energy seasonally?[11] [12]

Demand for heat for homes and other buildings is a larger part of the UK’s total energy requirements than is electricity. It is also varies far more seasonally. Is the right route forward to hugely over-invest in renewable electricity sources, such as PV, and then convert the surplus on a sunny July day into methane for use in December? It seems to me that if the UK wants to decarbonise the entire economy, and not just electricity production, that this might well be the right way forward.  The rise and rise of solar PV makes this more and more likely. Within two decades we are likely to see PV on a large portion of all roofs, domestic and other. This will mean, as already in Germany, that for four hours a day, six months a year net demand for grid electricity will fall substantially below current levels. If export is unavailable, then storage of power as methane may be economically attractive.

I will try to explore these topics in a further paper.


[1] Next steps on Electricity Market Reform – securing the benefits of low-carbon investment, Committee on Climate Change, May 2013

[2] For reasons that are very unclear, the CCC almost ignores PV in its 2030 projections. However, recent investment interest has resulted in rapid expansion of large PV farms using ground mounted panels. See, for example, http://www.larkenergy.co.uk/news/uk-s-largest-solar-farm-completed-and-grid-connected/. I project that falling costs of PV installations will take the UK’s PV capacity up from about 3 GW at the end of 2013 to 10 GW in 2030. For comparison, Germany already had about 34 GW in May 2013

[3] These assumptions are distilled from Next steps on Electricity Market Reform – securing the benefits of low-carbon investment, pages 30 and 31 and elsewhere in the CCC document.

[5] This information is published here: http://www.bmreports.com/bsp/bsp_home.htm . 3 months power production data is located by clicking on ‘Current/Historic’ underneath the ‘Generation by Fuel Type’ graph. These charts work best in Internet Explorer.

[6] Page 31 of the CCC’s Next steps on Electricity Market Reform – securing the benefits of low-carbon investment

[7] The utility SSE has planning permission to build a 30 GWh pumped storage plant at Coire Glas at a cost of £800m.

[8] The German figure is taken from the data produced by Dr Bruno Berger at the Fraunhofer Institute. (www.ise.fraunhofer.de)

[9] Spanish electricity production data can be found at https://demanda.ree.es/demandaGeneracionAreasEng.html

[10] See Figure 1.3 in the CCC’s recent Next steps on Electricity Market Reform – securing the benefits of low-carbon investment

[11] Power to Gas refers to any process that takes electricity and uses it to generate hydrogen through electrolysis and then adds the hydrogen to CO2 to make methane, the principal ingredient of conventional natural gas.

Solar is now cheaper than nuclear. Even in the UK.

The Breakthrough Institute, a Californian environment and energy research unit, has put out an eye-catching report about German solar subsidies. According to Breakthrough’s assessment, the feed-in tariffs paid since the start of the solar boom make PV four times as expensive as nuclear power, even using the inflated costs suggested by the construction of the reactor at Olkiluoto in Finland. Breakthrough should have made the point - but didn’t - that the initially generous feed-in tariff rates in Germany have been repeatedly cut. The correct analysis would have not have compared today’s nuclear costs with PV of a decade ago but the current costs of both technologies. At 2013 prices, solar PV in mid-latitude countries is now cheaper than new nuclear. Put in the UK context, the proposed EdF power station at Hinkley is now more expensive per unit of electricity generated than solar farms in the south of England.  The implications of this need a great deal more consideration than they are getting.

By itself, the cost crossover  doesn't mean that countries shouldn't invest in nuclear power. Nuclear delivers electricity reliably throughout the year. This baseload power is more valuable than PV’s high levels of output at midday in summer when demand levels are low in most of Europe. And nuclear power stations take up little space compared to the land needs for solar farms. Nevertheless nuclear proponents, such as Breakthrough, should recognise the truly staggering improvement in the economics of solar power around the world, mostly driven by the German government’s commitment to PV a decade ago.  Costs have fallen by approximately 75%. By contrast, it probably doesn't need saying, nuclear has nearly doubled in price.

The analysis

The ‘cost’ of the many options for generating electricity is difficult to calculate. For both nuclear and for PV, the underlying expense  of generating electricity is dominated by the required payment to the providers of the capital needed to build the plant. PV farms, for example, have operating costs close to zero and nuclear power operates at no more than £15 per megawatt hour. Whether nuclear electricity therefore  ‘costs’ £80 or £100 per megawatt hour crucially depends on the rate of interest demanded by financiers on the huge amounts of money needed to construct new power stations. This is even truer for solar farms.

We do know what EdF, the owner of the Hinkley site, thinks it needs to pay its capital providers. Press reports, not denied by the company, suggest that it believes that it needs a minimum price of £97 per megawatt hour in order to achieve a required 10% return on the capital used to build the plant. Agreement has yet to be reached with the UK government that such a price will be written into law as the ‘strike price’ which EdF will be paid for the output from Hinkley. Nevertheless, £97 is consistent with the calculations of outsiders looking at the £14bn financing challenge faced by EdF for the two proposed Somerset reactors.

The question I therefore asked was this: would a ‘strike price’ of £97 per megawatt hour (just under 10p per kilowatt hour) be enough to incentivise developers to build PV farms in reasonable locations on flat land in southern England with nearby grid connections? My extremely simple modelling assumptions were as follows.

  Assumption Notes
Capital cost £800,000 per megawatt installed In line with recent quotes from UK developers. This may rise as a consequence of the possible tariff wars between China and the rest of the world
Operating cost 1p per kilowatt hour produced A large PV farm needs monitoring and some security provision
Inflation 0% I understand that EdF’s requirement for £97 per MWh is index-linked. My assumption is therefore consistent for PV.
Life of the PV farm 30 years  
Yearly loss of power producing capacity as a result of panel decay 0.3%  
Output per kW installed 1000 kWh per year This is achievable across Cornwall, south Devon, and some parts of the rest of the south coast and the Isle of Wight.


These rough calculations suggest that a ‘strike price’ of £97 for solar electricity would yield a return of 11.3% on the funds committed.[1] This is more than the 10% return achieved by EdF on its proposed investment at Hinkley. Electricity from solar PV is therefore cheaper – in good locations – than nuclear.

This can be put another way. Developers of solar farms should be willing to accept a strike price of less than £100 per megawatt hour, if their required return is similar to EdF. My approximate calculations suggest that a figure of £88, indexed to price inflation as with the nuclear company, will give returns of 10% on PV investments. Perhaps as importantly, the financial risk attached to a solar farm is tiny compared to the roll of the dice at Hinkley. Investors will actually need a much lower return on PV than nuclear.

Are these conclusions consistent with the evidence from sunny counties? Yes, they very definitely are. Applications to build large PV farms are flying in to planning authorities. And what is the current price achieved for solar PV? A developer of large farm will receive 1.6 ROCs (Renewable Energy Certificates) worth today around £65-£70. In addition, they will sell the electricity, perhaps for £40 per megawatt hour, meaning that their total income will be just over £100 per megawatt hour. In other words, developers are rushing to build solar farms today at prices only very slightly higher than demanded by EdF for nuclear.

These farms are not always even in particularly good locations, such as the one that the comedian Griff Rhys Jones is currently complaining about in Suffolk. The marketplace is therefore saying that solar power is now cost-competitive with nuclear. I’ll try to address what I think are the enormous implications of this for energy policy, here and around the world, in a note on this web site soon. As we’re coming to realise, the fact that PV is now cheaper than retail electricity (and therefore doesn't actually need any subsidy at all if the electricity is all used on site) has the potential to really upset many of the assumptions we've made about renewable energy. Electricity markets have yet to understand the disruption that is likely to be caused.


[1] This is the Internal Rate of Return of a solar PV projects selling their electricity for £100 a megawatt hour.

How communities raise money for energy cooperatives

(This article was published on the Guardian web site on 29th April 2013.) This month a hydro project to generate electricity at a weir on the Thames in Oxford won the an investment of nearly £300,000 from 95 shareholders, three quarters of whom live in Oxford, within two weeks of opening its offer. Just a few weeks ago, the village of South Brent in Devon financed a large wind turbine almost entirely with local money.

Green energy projects owned by communities – long-talked about as a way to reduce emissions, cut bills and bring people together – are starting to raising serious amounts of money. But how?


Saskya Huggins, one of the volunteers who has organised the Osney hydro project in Oxford, said “when you get an opportunity like this that helps tackle a major global issue, albeit in a small way, and raises significant funds for your own community, you grab it with both hands.”


The two ventures share many features. Both had a core group of utterly committed volunteers like Huggins working for many years to bring the project to fruition. The Osney hydro plant has been in development for over a decade. South Brent’s team got planning permission three years ago but took until the late 2012 before being able to start fundraising.


In both places, the organisers are well known and trusted in their local community. This seems to have helped build the impetus behind the fundraising.


Charlotte Robinson, one of the Osney Hydro investors, said: “when I came to Oxford 10 years ago, this idea was reported in the local newspaper and I loved it, but I couldn’t see how such a big project could happen in such a small area. So I’ve been thinking about this for a decade, and was determined not to miss the boat. This sort of action gives me hope that a climate change revolution really is possible, even for non-leaders like me, by doing things from the bottom up and locally.  I feel incredibly lucky to be able to take part.”


Edward Chapman, one of the Devon organisers, actually discouraged publicity outside the area, saying he wanted to make sure as much money as possible came from individuals living close to the turbine.

He remarked on how early publicity for share issue had galvanised more support from local people. “The team of volunteers who assembled after the first open meeting back in January did an amazing job - the village was covered in banners and posters and they opened the “pop-up” shop for a week.”


The two schemes independently decided to offer investors an annual return of about 4% on their investment. This leaves large surpluses available for local schemes to reduce fuel poverty and meet other energy priorities within the community. Osney says it will put a total of £2m into energy projects in West Oxford during the forty year life of the hydro plant, more than three times the initial cost of the scheme. South Brent has its eye on using the money from the wind turbine to provide the seed funds for its own large hydro power scheme as well as insulating local homes.


The volunteers that have driven the two schemes forward were already experienced renewable energy investors. The Osney group had raised the money to invest in several large solar photovoltaic arrays on local buildings while one of the South Brent directors had rebuilt some of the village’s small electricity-generating water wheels and another works as a surveyor for a large renewable energy company.


In South Brent about 130 people put money into the wind turbine from a village population of only 3,000. Although other Devon wind turbines have been fiercely resisted – including some planned by other community groups - few voices were ever raised against the proposal. At Osney, over half the money came from less than a mile from the weir at which the generating plant will be built.


The average amounts invested were broadly similar in both cases. The Thames scheme raised an average of just over £3,000 per investor compared to £2,300 in Devon. All the Osney shareholders are individual people. A few companies and trusts invested in the South Brent wind turbine - usually buying relatively few shares - but over 95% of the investors are individuals.


The big brother of these two ventures is the Westmill Solar cooperative, which raised £4m from 1,600 small shareholders in the summer of last year to buy an existing solar farm near Swindon. The profile of the investors is similar to the two newer schemes. At £2,500, the average investment is about mid-way between the Osney and South Brent figures. Three quarters of the Westmill investment came from within twenty five miles.


The experience in Germany shows what might be achieved by encouraging such community power companies.


By the middle of 2012 over 500 energy cooperatives were operating in the country, with almost 170 founded in 2011 alone. Although the pace of growth is faster there, other features are very similar. At around £2,800, the average size of shareholding in these ventures is about the same as in the UK and, like here, over 90% of investors are private individuals. The typical dividend is 4%, similar to the rate proposed at Osney and South Brent.


Even in Germany, cooperatives still produce less than one tenth of one percent of the country’s electricity. However, the speed of growth suggests that local energy companies may eventually produce a respectable amount of the country’s power.


According to a recent survey [LINK??], the prime purpose behind the German cooperatives is not to make shareholders rich but to promote renewable energy and to keep money in the local economy. The same survey showed that the most important reason that the founders decided to form cooperatives, rather than conventional companies, was because of the democratic ‘one member, one vote’ nature of the decision taking. If my straw polls are any guide, it’s the same in the UK.


The experience at Osney and South Brent suggests that deeply rooted, cautiously run and philanthropic energy ventures can raise significant amounts of capital from local investors – even if the promised financial returns are quite limited.


(With many thanks to the volunteers in Osney and South Brent, particularly Saskya Huggins and Edward 'Joddy' Chapman, who answered my incessant questions).

Small renewables about 0.6% of UK electricity consumption

What percentage of the UK’s electricity is generated by small power plants supported by Feed In Tariffs?  I think the answer is about 0.6%. At current rates of growth, this will rise to about 1% by this time next year. Most power plants supported by Feed In Tariffs (FiTs) are small, often very small. Their output isn’t recorded in statistics of electricity generation. In fact most of the time the PV panels on your neighbour’s roof are reducing her electricity consumption rather than producing a flow of electricity into the power network. But knowing the rated power of installations claiming FiTs, and estimating how much yearly electricity each kilowatt produces,  we can guess the total amount of power produced over the course of a year.

The March FiT statistics have just been published. The total capacity of all installations registered under the scheme is now about 1.8 gigawatts (slightly larger than one of the new nuclear power stations planned for Hinkley in Somerset). Most of this capacity is solar PV.

Technology Share of total FiT installation capacity
Solar PV 88%
Wind 7%
Anaerobic digestion 2%
Hydro 2%


The imbalance is even more pronounced if we look at the number of installations. Solar PV is 99% of all sites claiming FiT because these installations are typically much smaller than wind or other technologies. Over 1 household in a 100 now has solar panels on the roof but these are generally below 4 kilowatts in size. A new wind turbine claiming FiTs might be hundred times the potential power.

PV panels don’t work at night, and barely  function on a cloudy December day. In fact, solar panels produce an average of about 10% of their rated capacity. So a 4 kilowatt array on a roof will, over the year, average about 400 watts. It’s more in Cornwall and less in Aberdeen but this is a roughly correct average.

We can use similar estimates for the other main feed-in technologies: wind, hydro and anaerobic digestion. My figures are in the table below

Technology Estimated output as percentage of rated capacity[1]
Solar PV 10%
Wind 25%
Anaerobic digestion 70%
Hydro 40%


The smaller technologies have higher percentage outputs, meaning that they contribute more to the electricity generated under the FiT scheme.

Simple multiplication produces the following estimates of annual electricity output from the currently installed FiT plants.

Technology Electricity  generation estimate (GWh)
Solar PV 1,381
Wind 281
Anaerobic digestion 234
Hydro 117
   
TOTAL 2,013


The total amount of electricity consumed in the UK in 2012 was about 317 GWh. (The amount generated was greater because of losses in distribution and in running the power stations themselves). Therefore the electricity generated under the FiT scheme was about 0.6% of all electricity used in homes, offices and businesses.

The amount of generating capacity inside the FiT scheme rose by 65% in the year to March 2013 and growth is fairly steady. Wind and AD grew much faster than the average, albeit from a small base. If the growth continues, all FiT installations in March 2014 will supply about 1% of UK electricity in the following year.


[1] Please tell me if you think these estimates are wrong

National Trust inconsistent in opposing all wind farms while saying it supports renewable energy

(A version of this article was published on the Guardian web site on Friday 19th April) (All praise to the National Trust for its recently announced commitment to increasing the use of renewable energies at its properties. The promise to produce over half its power and heat from heat pumps, wood, solar and hydro-electric power by 2020 is a model for all organisations. But at the same time as cutting its use of fossil fuels it is actively opposing others who want to do the same on land adjacent to its own. And as the largest environmental organisation in the UK with four million members its overall influence on the development of renewable energy is not benign.

The Trust is currently fighting against 25 wind farm proposals close to its houses or landholdings. Its determined and (so far) successful opposition to four wind turbines within sight of the majestic Lyveden New Bield ruin in Northamptonshire is a good example. The four proposed wind turbines would be easily visible from the property. To many, this is reason enough for the National Trust to lead the opponents of the scheme in court battles. The problem is that the annual electricity output of this small wind farm would be similar to the National Trust’s total renewable energy production in 2020. In other words, all its heavily publicised efforts to improve its own energy performance are outweighed by its block on just one commercial wind farm. Overall, the wind projects opposed by the Trust – some of which are large farms substantial distance offshore – offer the prospect of several hundred times as much energy as it could conceivably generate from other technologies on its own land.

The National Trust owns 250,000 hectares, about 1% of the total area of the UK. A large fraction of this land is in windy coastland areas suitable for the development of wind energy. By its almost blanket opposition to the development of turbines, onshore or offshore, within sight of its landholdings, the Trust is slowing the growth of the UK’s lowest cost form of renewable electricity generation. It reserves the right to comment on proposed wind turbines that are up to 15 kilometres from the nearest National Trust property implying, one suspects, most the western coastline of the UK is within its purview. In fact it goes further:  the Trust’s list of wind farms that it is ‘keeping an eye on and/or opposing’ includes the offshore Celtic Array, which will be at least 19 km from the nearest part of Anglesey.

The number of days each year when this wind farm will be actually visible from rainy west Wales will be few. Nevertheless Simon Jenkins, the chair of the National Trust, has asserted an unqualified and almost feudal right to complain about prospective wind turbines that ‘blot the landscape when seen from our territory’. (Source: Financial Times, March 8 2013).

In contrast, the Trust itself regularly comments on the need to reduce the UK’s emissions. It recognises that climate change is likely to have more effect on its historic houses than other buildings, commenting that ‘The National Trust is already experiencing the impacts of climate change at many properties, such as flooding, storm damage, rainwater incursion, vegetation change and habitat changes.

So I asked the Trust why it rarely, if ever, actually supported wind development anywhere in the UK. It responded by providing details of just three applications that it had backed. The first was a Devon wind farm that was, in the Trust’s own words, hardly within sight of its land: ‘open visibility’ it said ‘is largely restricted to the very southern end of the park’. The others were similarly only just within view of the Trust’s properties.

More generally, The Trust told me that it did not have the resources to actively back wind developments. Like others, perhaps, I found this a strange comment from an organisation with an income of £400m a year, four million members and a clear awareness of the threats from climate change. It is prepared to throw huge sums at resisting wind farms it doesn’t like but won’t even write a letter to support even the most inoffensive developments.

No one should doubt the Trust’s own commitment to increasing the use of small scale renewables at its own properties. But therein lies the problem. Small scale renewables will never provide the amount of low carbon electricity that the UK is committed to generating by 2020. Wind power, particularly onshore, is quick to develop and relatively low cost. And it is effective: turbines provided 15% of the UK’s electricity during last Sunday and new output records are being set by the week. We urgently need the Trust to move away from its unthinking opposition to commercial wind power. Its moral influence in the UK is unmatched and a more rational view of the importance of wind is long overdue.