Ofgem hands the chalice to the Competition and Markets Authority

Ofgem has asked the Competition and Markets Authority (CMA) to review the workings of the UK energy market. As a result, we’re now in for three to six years of investigations, draft decisions and endless appeals. The energy firms will spend £10m a year on City lawyers contesting every single paragraph that the CMA produces and little will eventually change. Regulatory processes in the UK stink. Let’s look on the bright side. The document setting out the reasons for Ofgem decision is really clear, well-written and comprehensive. But it’s 120 pages long. So here are some of the most striking factoids that back up Ofgem's conclusion that the Big Six aren't competing effectively in supplying domestic customers.

In summary, Ofgem said that it had evidence of four different problems with the working of competition

a) For some customers, including those in vulnerable groups, the individual companies had the power to hold prices too high, particularly in the regions of the country in which they used to be the local electricity monopolist

b) Many features of the market make it possible for the Big Six to 'coordinate' their price changes. This has allowed the companies to increase prices more than would normally be possible in a truly competitive market. This problem, Ofgem alleges, is getting worse as the amount of switching between suppliers falls. Prices rise faster than they come down in response to changes in costs. No illegality is suggested: 'coordination' is not outside the law if it is done without any form of direct communication between companies. Ofcom is at pains to say it has found no evidence of any form of illegal price rigging.)

c) Although smaller entrants have made headway in the last year, they don't threaten the dominance of the big companies. This dominance is exacerbated by several features of the electricity market, including the relatively small amounts of electricity trading and by the 'self-supply' of the vertically integrated Big Six.

d) The growing discontent with the electricity and gas companies is causing consumers to disengage from switching between suppliers or actively looking for better deals. This is bad for competition.

Background

  1. Average dual fuel prices increased by 24% between 2009 and 2013 compared to a 14% rise in the CPI. Average energy use per home has fallen, meaning that expenditure on electricity and gas has only risen slightly faster than inflation. (1.1 and 1.2)
  2. The cost of wholesale gas and electricity used to service the average dual fuel customer fell by 5% between 2009 and 2012. (Figure 1)
  3. The total earnings (EBIT) of the Big Six, including profits from generation, supply to businesses and supply to homes, rose from £3.1bn in 2009 to £3.7bn in 2012. Generation profits fell, as did business supply.
  4. Profits made from domestic customers more than compensated for this rise by increasing five fold from £233m to £1,190m over the four year period.(Figure 2)
  5. Overall, the generation businesses of the Big Six just about covered their costs of capital. (6.79)
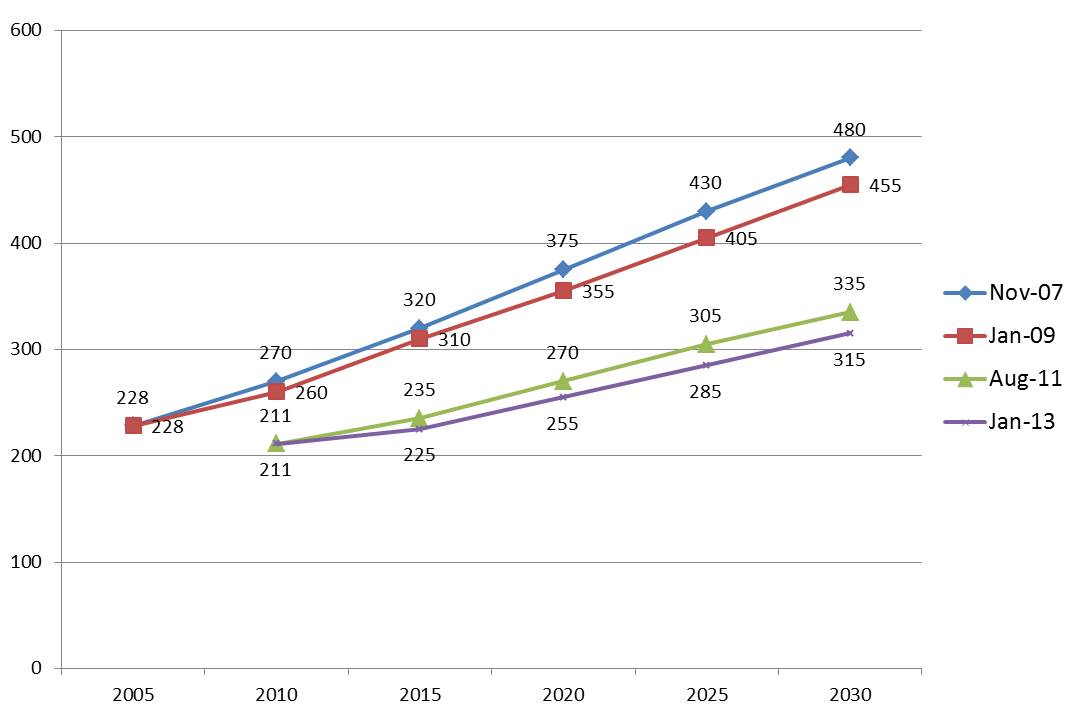
  6. At the level of the individual customer, the average retail margin before operating costs to a Big Six supplier from a dual fuel account approached £300 in 2013 having been almost nothing at the end of 2005. (Figure 36). This is in addition to generation profits, of course.
  7. Margins for domestic electricity fell from 2009 to 2012 from 2.2% to 1.8%. Gas supply margins rose sharply from -0.3% to 6.7% over the period. (1.6)
  8. Some suppliers contend that an overall 5% return from domestic customers is a ‘fair’ margin. Ofcom found no evidence to support this. (1.8)

Evidence for suppliers having the power to charge more in regions where they are in a strong position (‘unilateral power’)

  1. Market shares for incumbent electricity suppliers (companies that used to have regional monopolies before privatisation) are materially higher in their home regions. Centrica, which had a nationwide monopoly of gas supply still has a 40% share of domestic gas sales. (1.10) 37% of electricity customers are with their incumbent suppliers (4.5)
  2. On average, 48% of the customer base of a Big Six electricity supplier is in its home (incumbent) region. (4.18). For single fuel electricity customers this number is even higher at 69% (4.20)
  3. Incumbent customers generally switch less (4.5) The figure is about a quarter of the level of non-incumbent customers (Figure 23). This gives the suppliers the ability to force up prices disproportionately in their home regions. (So called ‘unilateral’ power)
  4. ‘Suppliers are able to segment their customer base, and charge different groups of customers different prices for what is essentially the same product’. Non-switching, or ‘sticky’ customers pay more partly because they tend to be on single fuel tariffs.
  5. On average, single fuel incumbent customers pay £40 a year more than if they shopped around for electricity or gas from another supplier.
  6. Crucially, therefore, Ofgem finds ‘these price differentials to be consistent with suppliers having a degree of unilateral power’. (4.29)
  7. New, non-Big Six, suppliers now have over 5% of both the gas and the electricity markets up over 2 percentage points since early 2013. However ‘it is unclear that any existing supplier will achieve sufficient scale in the near term to act as a disruptive constraint’. (1.11)

The Big Six are tending to converge and ‘tacitly coordinate’ their price changes.

  1. Switching rates have shown a strongly falling trend since 2008, despite persistent price differentials. (1.12). The rates of switching among the Big Six are tending to converge. (4.55). Retail margins are also tending to converge. (4.57). Taken together, this evidence is consistent with ‘tacit collusion’, a legal form of diminishing competition and a second reason, after ‘unilateral’ power why the market seems not be to working well.
  2. Average retail prices among the Big Six are increasingly tracking each other. (Figures 31 and 32). This is also a feature of a market with tacit collusion or coordination.
  3. Price changes have become more similar in size over time among different suppliers (4.68).
  4. These features of the market push Ofgem to say that the evidence suggests that tacit collusion may be becoming more effective over time (4.62)
  5. Ofgem thinks that the evidence for tacit collusion is reasonably strong. The large suppliers announce price changes around the same time and of a similar magnitude. Profitability of domestic supply has risen for all large suppliers and supply margins have converged.
  6. The intensity of competition for domestic customers is falling. (4.11)

Prices go up faster than they come down

  1. Large suppliers raise prices rapidly when costs are increasing, and cut them slowly when costs are falling. (1.28)
  2. More specifically, ‘we found that suppliers do not adjust their prices as quickly when costs come fall compared to when wholesale costs rise. We ran this analysis using a number of different model specifications all of which showed this asymmetry.’ (4.86)

Switching behaviour is increasingly ineffective at constraining the big suppliers.

  1. 62% of customers could not recall ever having switched supplier. (1.13) Another 14-16% have only switched once. (3.17)
  2. One in ten of all consumers are not aware that it is possible to switch supplier. (1.43) The DE social group figure is 21% and the number for ‘Black and Ethnic Minority Groups’ is 39% (3.8)
  3. A 2013 survey suggested that 43% of customers do not trust energy companies to be open and transparent, up 4 points from 2012. Ofgen considers this to be ‘an extremely high figure’ for an essential service. (Para 1.16)
  4. Ofgem says that the market is highly segmented. Many customers are non-switchers and this segment of the market faces persistently higher prices. At the other extreme, customers who manage their accounts online, pay by direct debit and buy fixed price deals do better. Because the new suppliers are obliged to focus on this segment, their profitability is inherently lower. (This last sentence is my inference from 1.17)
  5. Ofgem says that competition for domestic customers isn’t working properly. It points to the existence of the persistently non-switching segment, who are systematically charged more and three other factors. These are ‘tacit coordination’, barriers to entry and expansion and weak customer pressure.   (1.20)
  6. Typical single fuel customers would benefit by £100 by switching to the best priced single fuel tariff. But the average customer requires a saving of at least this amount before she/he thinks it is worthwhile.
  7. Ofgem found a price difference of £250 between the average ‘incumbent’ single fuel tariffs and the best online dual fuel direct debit tariff offered by small suppliers (1.25)
  8. 62% of people think there are too many tariffs available. 54% said that they understood their options ‘not very much’ or ‘not at all’. (1.44)
  9. 26% of those switching in the year to April 2012 would not do so again. (1.45)
  10. Only about 20% of customers are on fixed term tariffs. (2.11)
  11. Customers are ‘bewildered’ and feel ‘disempowered’ by the choice of tariffs. (3.12) ‘If consumers cannot easily or effectively compare… products … this may allow firms to exercise market power (3.9)
  12. Language experts hired by Ofgem concluded that a lack of clear communications and standardised language compounds the belief among consumers that the energy market is confusing. (3.14)
  13. Switching rates are falling and switching behaviour is increasingly concentrated in a limited, better off subgroup. Vulnerable consumers are ‘disproportionately’ likely to never switch.

Vertical integration is harming competition by restraining new entrants

  1. Vertical integration is a key feature of the UK market. The Big Six own 70% of electricity generation capacity. (1.36) This is double what it was in 2000 (5.58)
  2. Vertical integration makes entry and expansion difficult, partly because it means that the wholesale market for electricity is not liquid and neither does it enable long-term hedging of prices (that is, new entrants find it difficult or expensive to buy in advance the electricity they need for future months and years).
  3. Trading in the UK electricity market has fallen substantially in the last decade. The average unit of electricity was traded 7 times before delivery in 2002 and only 3 times in 2013. These later figure is much lower than in Germany, which has an even more concentrated retail supply market. (5.26, 5.27)
  4. Furthermore new entrants are unable to fund the high capital requirements to become fully effective participants in the buying and selling of energy.
  5. Ofgem concludes that it is ‘concerned that vertical integration may have a detrimental effect on competition by imposing barriers to entry and expansion and by reducing liquidity in the wholesale market’. (5.92)

Other findings pushing Ofgem into thinking a full competition investigation is required

  1. Satisfaction with suppliers has gone down 12 percentage points to 52% in the last five years.
  2. Customer complaints are rising, sharply in the case of some suppliers. Complaints are up 50% since 2011. (3.21)
  3. 18% ‘completely distrusted’ energy suppliers in 2013, up from 13% in 2012. (3.22)
  4. The numbers saying that they are not switching because they are happy with their current supplier was 55% in 2013 compared to 78% in the previous year. (Figure 14)
  5. The time taken by industry participants to organise a switch of supplier is now five weeks though the suppliers have committed to cutting this by a half within a year. (3.44)
  6. Ofgem says that some companies have looked at entering the energy supply business put have been put off by the risk to their wider reputations from being involved in an industry with severe customer relations problems.

The Ofgem document is a fine piece of work and a model of clarity and terse argument. Congratulations to the people who wrote it.

Cool Planet: the most plausible producer of cellulose-based fuels yet

  Cool Planet's core technologies

Nature had a recent article on the poor health of advanced biofuels companies in the US. Entitled ‘Cellulosic  ethanol fights for life’, the author took particular aim at the new Abengoa refinery in Kansas that uses enzymes to break up the complex cellulose molecule into sugars that can then be fermented into ethanol.

The Abengoa plant was expensive to build, is one mile square in size and probably produces ethanol from cellulose at a cost that makes it uncompetitive with first generation corn ethanol plants. Nature may have been right to be gloomy about its prospects.

But this doesn’t mean that all the companies intending to make fuels from cellulose – the most abundant organic molecule in the world – suffer from similar problems. Actually, 2014 may see greater advances in the production of low-carbon biofuels than ever before. After nearly a decade of failure, it looks increasingly likely that cellulose will eventually become a useful source of transport fuels around the world. Although Abengoa may have built a refinery that embodies a technological dead-end, others such as the extraordinary Cool Planet, may show that low-value plant matter is capable of being turned into fuel that can compete on price with fossil fuels. And Cool Planet is also turning out large volumes of biochar as a by-product. I think this is one of the most interesting companies in the world.

Five years ago I published a book about the technologies that I thought would help the world wean itself off fossil fuels. Of course I was almost ridiculously optimistic (except about solar PV, where I was too conservative) and many of the low carbon energy sources I wrote – such as power from the flow of the tides - about have made strikingly slow progress.

Another one of the chapters was about using cellulose molecules to create motor fuels. I was at pains to distinguish cellulose-based petrol from the first generation biofuel plants that break down the simple starches in grain to make ethanol. As is now well understood, using foodstuffs to make fuel for cars is a terrible diversion of valuable calories. Moreover, the typical human needs about 2 kWh of food a day but her car might consume ten or twenty times this amount of energy. Turning maize or wheat into motor fuel can never be a real solution to the need for low-carbon travel.

But cellulose could be different, I suggested. It is everywhere. Leaves, grasses and stalks are largely made from it and it provides the soft structure for a plant’s energy capture and conversion systems. (Lignin is the dominant molecule in woody biomass). Cellulose is composed of long chains of strongly linked sugar molecules which cannot be broken down by humans. Some plant eating animals, such as cows, house useful bacteria in their stomachs that exude enzymes that can chop up cellulose into much simpler molecules. But the vast bulk of the world’s cellulose production is wasted, eventually rotting away and giving up carbon dioxide to the atmosphere.

Since I wrote the book in 2008 many companies have tried to find ways of breaking up cellulose from organic sources such as wood chip or maize stalks. Many have mimicked grass eating animals by using enzymes and applying gentle heat to break up these intractable molecules. Once they’ve got a soup of simpler chains of atoms using these enzymes they use fermentation to turn starches into ethanol (a product we usually call alcohol).  Most have failed, at considerable cost to their investors including the most important backer, Vinod Khosla. The last few weeks have seen KiOR, one of Khosla’s many investments and one of the few companies actually to build a working refinery, announce it wasn’t certain it could continue. Without more money from Khosla or co-investor Bill Gates, the company would run out of cash because its plant hasn’t been able to produce as much ethanol as it expected or the purity of fuel it needs.

So what’s different about Cool Planet and the other new companies working to get motor fuels out of biomass? The main change is that many of these companies are intending to use pyrolysis, the process of heating biomass in the absence of air, instead of breaking cellulose up using enzymes and then fermentation. When biomass is heated to several hundred degrees during pyrolysis, its molecules break up into simpler hydrocarbons which are then driven off in the form of gas. As they cool, these hydrocarbons become oily liquids, often called bio-oil. What remains at the end of pyrolysis, provided the temperature has been high enough, is a fairly pure carbon charcoal. Or ‘biochar’ to its growing band of enthusiastic followers.

Cool Planet’s patent documents show that the company’s approach is to slice wood or other biomass into very thin strips which then subjected to pyrolysis at higher and higher temperatures in separate chambers. It’s as though a wood chip is moved from a cool oven to increasingly hot ones over a short period. The rising temperatures in each sequential oven drive off a different gas in each case. This has the crucial advantage of ensuring that the Cool Planet biorefinery can capture a pure stream of gas that cools to a distinct oil at each point in the process. In this respect, it is similar to a conventional oil refinery, which distils various oils into different streams, with petrol usually being a key output alongside diesel and aviation fuel. This is presumably why it calls its central process 'fractionation'.

The Cool Planet approach has the crucial advantage of creating separate streams of oils. Older pyrolysis processes produce a mixture of various different oils and other chemicals that have relatively little value as motor fuels. Cool Planet’s trial refinery in California is said to produce oils, such as gasoline, that are chemically indistinguishable from fossil equivalents. One story told by the company is that tests by a sceptical oil company were only able to say it wasn’t a fossil fuel by the use of carbon dating. The cellulose was new, whereas oil is often hundreds of millions of years old.

It’s particularly important to note that Cool Planet and some of its recently formed competitors are seeking to produce a true drop-in replacement for petrol/gasoline. It fuels are chemically identical to what comes out of conventional oil refineries. They are not following the earlier cellulose processors in trying to make ethanol, which is a fuel that can be added to fuel but which modern engines cannot usually accept in high concentrations. (Of course Henry Ford initially believed that plant-derived ethanol was a better fuel for cars but modern engines have been adapted to burn fossil fuels).

After experimenting with its prototype in California for several years, Cool Planet has just broken the ground for a full sized refinery in Louisiana. When I say ‘full-sized’, I mean a plant of perhaps a hundredth or less of the output of a conventional oil refinery. 200 million litres a year is the target production starting late in 2014. What will also come out is a huge amount of residual biochar, dwarfing the current world production of this valuable soil enhancer. Not unexpectedly, the company is trying to get rapid endorsement of the value of biochar in improving agricultural yields. (Earlier articles on this website talk enthusiastically about the potential usefulness of biochar, and another chapter of my 2008 book also lauds its importance, perhaps a little too uncritically).

All companies trying to convert biomass into useful oils bandy figures around about the low cost of cellulosic-based oils. Most have been absurdly optimistic. Nevertheless Cool Planet doesn’t hesitate to join in, offering estimates as low as 20p a litre, or about a third of current petrol prices excluding UK tax. Its biomass sources, initially intended to be trees from Colorado that have been destroyed by beetle infestations, are cheap but the crucial reason for its lower cost than first generation cellulose fuels is probably the relative simplicity of the refinery.

The value of the biochar – trading at up to £4 a kilo in small quantities on UK websites - will help improve the economics of the process, perhaps by a large amount. In some interviews, company executives seem more taken by the value of the char than they are of the oils. They also proudly boast of the carbon negative fuels that their refineries will produce; biochar lasts for hundreds of years in soil, this storing carbon that would otherwise have rotted into CO2 or methane.

Cool Planet envisages hundreds of small refineries around the US, gobbling up local biomass surpluses, whether of dead trees or otherwise useless agricultural wastes. The capital costs of the first Louisana refinery are around 25p per litre of annual output. Executives talk of cutting this in half within a few years. These are really impressive numbers, if true. Other investors in places like Malaysia are licencing the rights to the intellectual property in order to build their own refineries.

Is this all another fantasy, like so much of the renewable fuels experiment has proved to be? Of course I don’t know but something about this company looks profoundly convincing. Investors include Google, BP, the forward looking US electricity company NRG, GE and several other sceptical corporations. The team is strong and the detailed and meticulous research behind its refineries seems robust. The four key patents, although extremely widely drawn, have a simple plausibility about them. I think this will work.


Maize in anaerobic digesters: Is Monbiot right?

  George Monbiot points his critical attention to the increasing use of food crops in the UK’s anaerobic digesters (AD). These huge green cylinders, usually on farms, take organic matter, expose it to bugs that have excrete enzymes that eat cellulose and starch in the absence of air. The bugs produce a mixture of methane and carbon dioxide as an output. This ‘biogas’ that comes out of AD plants is burnt in an engine to produce electricity.

Many digesters use the human waste from water treatment plants or from animal slurry while others take waste from food factories or from doorstep collections. But increasing number of AD plants are using maize and other food crops because the simple starches in these ingredients break down very well, creating more cubic metres of  valuable methane gas than, for example, the more complex molecules in cow manure. Many UK AD plants – built to digest municipal waste, for example – are now boosting their yields by mixing in maize that would otherwise have been used as food for animals or people.

Does it make sense in energy terms to grow maize (or even wheat) as a feedstock for a digester? No. The energy value of the methane that is produced in an AD plant, converted into electricity via a gas engine, is about 0.4 megawatt hours per tonne. This is approximately a tenth as much as the calorific value of maize to a human being.

This isn’t the whole story, since the digestate left behind after the energy has been extracted in an AD plant does have some value as a replacement fertiliser when it is reapplied to the fields. Nevertheless, putting maize into an AD plant to make energy involves a huge loss of calorific value. And the climate change implications also need considering: as well as the energy used in the Haber Bosch process the high levels of nitrogen fertiliser used on maize land produce large amounts of nitrous oxide, a powerful warming gas.

Monbiot has also recently shown the other cost of growing maize for AD: land used for maize has low water retention capacity in winter. The recent floods on the Somerset  Levels were exacerbated by the large areas of adjacent land given over to maize. If, instead, these hectares had been planted with short rotation coppice, such as hazel or willow, more water would have been stored in the soil. And, second, the energy value of the harvested wood, converted into pellets for use in domestic wood burners would have been about twice as great as the energy captured from the same area given over to maize for anaerobic digestion.

There are no good arguments for using productive food land for maize that is then pumped into an AD plant. (AD plants may get more effective at conversion of cellulose in the future and this might affect the universality of this assertion).

My calculations are as follows. (Comments *very* welcome indeed).

Maize in AD

(Figures taken from Farmers’ Guardian and used by Monbiot in the other Guardian).


Raw material needed by an AD plant creating 1 MW of electricity 20,000 tonnes of maize a year*
   
Annual electricity production from a 1 MW plant operating 8,000 hours a year 8,000 megawatt hours a year
   
Therefore, electricity output per tonne of maize 0.4 megawatt hours
   
Calorific value of maize in human diet per tonne About 4 megawatt hours
   
Food value compared to electricity production value Therefore maize’s food value is about 10 times its value in an AD plant

*Farmers’ Guardian says ’20,000-25,000 tonnes’ needed


Maize versus short rotation coppice

Energy value of electricity per hectare generated by maize in AD plant 17.8 MWh**
   
Tonnes of SRC per hectare (oven dried equivalent)*** 10 tonnes
   
Energy value of SRC per tonne 4.5 MWh
Efficiency if burnt in a biomass pellet stove in a domestic/small commercial property 80%
   
Usable energy value per hectare of SRC 36 MWh
   
Energy value of SRC versus maize digested in an AD plant Therefore SRC (36 MWh) about twice as good as maize (17.8 MWh) per hectare

** Farmers’ Guardian says 450 hectares produces 20000 tonnes of maize that is enough to provide the fuel for a 1 MW plant (therefore about 8,000 MWh per year).

*** To get this yield requires good husbandry but would be perfectly possible on the Somerset Levels.

The Salford Energy House shows the precise benefit of solid wall insulation

energy houseThe Salford Energy House is a remarkable laboratory. A reconstructed 1919 end-of-terrace dwelling, it sits within a completely insulated warehouse on the university campus . External temperatures can be precisely adjusted. Simulated rain falls from the ceiling onto the roof of the house. Wind is mimicked by giant fans. 400 measurements can be taken every minute. Researchers are able to make large and small changes to the house (such as opening or closing the curtains) and measure accurately what the impact is on energy consumption and internal temperatures. This is the only place in the world, I was told when I visited a couple of weeks ago, where the real impact of energy-saving measures can be exactly calculated.

Commercial companies can use the house for experiments. The building products company St Gobain recently released some details of the work it has carried out on the Salford house. Although the published data is very sketchy, the headlines suggest that external wall insulation can be much more effective than some other estimates would suggest. When St Gobain put insulation on the outside of the end of the house and the back wall and also added internal insulation on the front wall, it reduced heat loss by almost 50%, saving over £250 a year. This is about three times what the latest government data suggests. The reasons will include the care with which the St Gobain staff installed the insulation and the quality of the product.

About 7 million houses in the UK have solid walls, about a quarter of the total stock of homes. These houses were usually built before the mid-1920s, when cavity wall insulation became almost universal in single family dwellings. A typical Victorian terrace has brick walls, often only one brick thick. Such houses, still popular with their owners, are amongst the most energy inefficient in the Western world. Solid wall insulation – either on the outside of the brick or on the inside of the house is the most important improvement that can be made. Reducing the heat need in these homes (1/4 of the stock) by up to 50% by using solid wall insulation would cut UK carbon emissions from domestic heating by about 12%. This is not an overwhelming number but external wall insulation is one of the two or three most important individual energy improvements that the UK can make.

An earlier article on this web site looked at the results from the National Energy Efficiency Database (N-E-E-D). This database showed that the real world results from most energy efficiency measures were much less than other government sources predicted. For example, increasing the thickness of loft insulation had very little effect on actual energy consumption. The N-E-E-D results also suggested that solid wall insulation measures were not particularly effective. The average installation was shown to reduce its energy consumption by about 2,000 kWh a year, perhaps a sixth of the total heating bill.

So the Salford results are much better. In the laboratory, where St Gobain technicians could carefully fit insulation without fear of being rained on or being distracted in other ways, the savings seem to be about 6,000 kWh a year, three times the level suggested by N-E-E-D for real world houses.  The explanations for the difference are well known: the work will have been done more carefully and precisely in Salford, the materials will have been first-rate and – perhaps critically- the laboratory house was still run at the same temperature once the insulation was completed. (Better insulation sometimes seems to encourage the householder to turn up the thermostat, taking back some of the savings).

So the good news is that solid wall insulation can really make a difference to energy consumption. But this is balanced by the high cost of such measures. Even a small terraced house, such as the Salford lab, would face a bill of over £5,000 for good insulation, possibly much more. The annual return would therefore be less than 5% or so. This isn’t sufficient to incentivise most householders, although they would certainly benefit from a more comfortable and less draughty house. However government can borrow at much less than 5% so it may makes financial sense to think about a national programme of solid wall insulation.

What about the other measures that the St Gobain team undertook? Topping up loft insulation saved about £20 a year, underfloor insulation and better windows cut bills by about £35 for each measure. These are all quite small savings and its worth reiterating the point that the cash benefits wouldn’t justify taking out a Green Deal loan to finance the improvements. (Unlike the results for external wall insulation, the St Gobain figures for loft insulation are similar to the figures suggested by N-E-E-D for real homes).

We all like to think that energy efficiency improvements are financially sensible. These latest Salford results suggest that the reality is more complex: if you have savings mouldering in a close-to-zero interest bank account then improving the fabric of your home may make sense. But for new homeowners stretched by mortgage payments, insulation will not look financially attractive.


Total UK energy use fell by about 4% in 2013

  Today’s provisional energy consumption figures from DECC suggest a striking improvement in energy efficiency in 2013. The key ratio of primary energy use to UK GDP improved by about 4%. Expressed another way, energy consumption in 2013 fell by 2% as the economy grew by about 1.9%. This ratio has improved an average of 2.8% a year since 2000, suggesting that the rate of efficiency improvement may be increasing.

Whatever else the UK is doing wrong in energy policy, there’s little doubt that overall energy use is tending to fall quite sharply. Much of this improvement may be driven by rising energy prices. In recent years, the rise in wind power production has also helped; a turbine’s usable power is nearly as much the primary energy it produces but it takes about two units of input energy to make one unit of electricity from fossil fuel. This effect alone represented one percentage point of the decrease in total (‘primary’) energy use. Nevertheless if the UK returns to the average growth rates of pre-2007 of around 2-2.5% a year, total energy use seems likely to continue to fall.

Primary Energy production

Tesla announcing plan to become world's largest rechargeable battery manufacturer

Tesla snapTesla isn’t just a car company producing the world’s best regarded electric vehicles. It’s also driving forward a network of very fast chargers (20 minutes or so) across the US and its other important markets such as Norway. And, lastly but most significantly, it is changing the economics of battery storage.

Nobody quite knows how far Tesla has pushed down the price of batteries but some commentators suggest that the business is already paying less than $250 a kWh for its lithium ion rechargeable packs. At this price, it might almost makes sense to use Tesla batteries to store domestic solar power. And, tagged on to the end of the annual letter to shareholders written last week, the company confirms that its ambition is indeed to provide electricity storage for solar PV installations as well for its cars.

Within the next few days Tesla will be announcing its plans for the world’s largest battery factory.  The gossip is that a site in New Mexico will be chosen for what Tesla founder Elon  Musk calls a ‘gigafactory’. This single site will be making about the half the world’s total supply of lithium ion batteries in three or four years’ time. Tesla will need more capital to finance this $2bn+ investment but the stock market and company shareholder Panasonic seem more than willing to stump up the cash.

The reason for the new factory is obvious.  Musk wants to sell half a million a year of his third generation of cars, probably starting in 2017. The big bottleneck is batteries. The world will buy about 2 billion phones this year, almost all with lithium ion batteries made to the same basic design as each Tesla’s 8,000 cells of stored electricity in its current cars. The table  below shows that Tesla’s need for batteries will exceed that of all the mobile phone manufacturers in the world. Even if you add in 100 million tablets and other electronic devices sold each year and Tesla still probably will need to double the world capacity to make lithium ion cells. Musk knows that without an enormous new factory, he’ll never get enough batteries.

Table 1

Phones
 
1800 million phones
times
0.01 kWh each of battery
equals 
18 million kWh of batteries
 
Tesla
 
0.5 million Tesla cars a year
times 
50 kWh battery pack in each
equals
25 million kWh of batteries

If he can push the cost of batteries down to $200/kWh by the latter part of the decade, the storage pack in a car with 50 kWh (perhaps 200 miles range) will cost about $10,000. Call that £8,000 at retail, but with a saving of perhaps £2,000 in fuel costs a year and the financial arguments for going electric begin to look strong. In a stroke of the marketing genius that characterises the company, charging the car at one of its 20 minute ‘superchargers’ is free. Add in the likely lower long run costs of maintaining an electric car, and Tesla’s highly impressive safety performance and the case for going electric begins to seem very persuasive by the last years of this decade.  Its aim to drive mass-market adoption of electric cars looks achievable.

Tesla has had a wider ambition for some time. Once it has driven down the price of batteries far enough, it becomes sensible to use them to store electricity from small scale renewables. You won’t have to buy a car: small sized battery packs will sit in the garage sopping up excess power from the panels on the roof when the home wouldn’t otherwise use the electricity.

What would the economics look like for a householder in the UK with 4 kW of solar panels on the roof and a 5kWh battery pack, perhaps costing £1,000 installed?

Table 2

4kw of PV
produces
3,500 kWh  a year
of which
2,000 kWh spilled to grid per year
of which
1,000 kWh usefully stored in batteries for night use[1]
saving
14p per kWh
produces
£140 saving  a year


The returns aren’t great. Not many people will spend £1,000 on something only saving £140 a year. But Musk openly talks about getting battery costs down to $100 a kWh within a decade or so. At some point in the not-to-distant future domestic electricity storage using lithium ion batteries begins to look compelling, particularly if power prices continue their upward course.

Many start-ups around the world are focusing on battery technologies that don’t use lithium ion. But whatever the fundamental advantages of these approaches, they face the unpleasant prospect of having to compete with a Tesla’s enormous manufacturing scale and rapid growing experience of making cheaper and cheaper cells. Even if lithium ion isn’t the best approach, with Musk’s blessing it will probably destroy the chances of any competing technology getting successfully to market, at least in niches up to 1 MWh or so.


[1] A 5 kWh battery will not be able to handle the surplus power from a 4 kW array in high summer so only part of the electricity produced by the PV and not used by the house will be storable. Second, many households have relatively low nighttime power use at times when the sun is strongest. It may be that the battery will not be discharged overnight at such times.

As they age, wind turbines generate about 1.6% less power each year

All machines get less efficient as they grow older. Wind turbines are no exception to the rule. A new study shows that a turbine has an average ‘capacity factor’ of 28.5% when new and this falls to about 21% in the nineteenth year of its life. (1) This finding implies shows that the average wind farm loses just less than 1.6% of its expected output for each year that passes. Over a twenty year working life, a turbine will therefore produce about 12% less electricity than predicted by the manufacturers. Some of this decline is due to the turbine being out of action and awaiting maintenance more frequently later in its life. Another reason is simple wear and tear. These results are very different to those obtained by Gordon Hughes and published in late 2012. Hughes said that the rate of decline was very much faster, calculating that typical output of a wind farm halved by the fifteenth year, implying a rate of decline three times the speed of the new study. Hughes didn’t use estimates of actual wind speeds and experts such as DECC Chief Scientist Professor David MacKay have strongly criticised the statistical techniques he employed.

Iain Staffell and Richard Green of Imperial College Business School have produced an elegant and clear paper that is accessible to non-technical readers. Their most significant advance over the work of Gordon Hughes is that they incorporate estimates of the hourly wind speed at each of the several hundred UK wind farms. Since we know how much each type of wind turbine should produce at different wind speeds, Staffell and Green were able to calculate whether the performance deteriorated at time. If a turbine aged ten years produces 15% less power at a specific wind speed than it did when it was new, we can use this figure, along with many thousands more from that turbine, to calculate its rate of degradation.

Staffell graphic.jpeg

Staffell and Green show that the 1.6% annual rate of output decline is fairly consistent among turbines of different vintages, and across the UK’s many wind farms, although they do suggest that the newest turbines may be performing better than predicted. Perhaps this latter finding is because of better maintenance in the first years of their lives when manufacturers offer performance guarantees. It’s also important to note that their findings are compatible with the real-life experience of wind farm operators, who were amazed at Hughes’ estimates of performance fall-off.

The wind speed estimates that Staffell and Green use aren’t perfect. Although each large wind turbine in the UK has an anemometer on its nacelle that measures and records wind data, this information isn’t made public. Staffell and Green were therefore forced to use a huge NASA database of wind speeds at low heights above the ground taken from weather stations, balloons, aircraft, ships, buoys and satellites. The resolution of this data is only down to squares of about 50km by 50km. However when the researchers looked at how well the NASA data predicted wind power output across the UK’s wind farms they found a very good fit. Their simulations of wind speeds in 50*50 km squares seem to give excellent predictions of power output from wind turbines inside those areas.

Gordon Hughes’ highly controversial 2012 study didn’t use wind speed data at all. In fact his model allowed wind speeds to rise across the last twenty years and used this increase as an input into the model. (Actually, if anything, UK wind speeds have tended to fall over the last couple of decades - at least until the last three months - so this was a very strange technique to use). The reason his research showed much higher rates of performance degradation is therefore that old wind farms, such as Delabole in Cornwall, appear in his model to be losing power because their output has stayed relatively flat, rather than rising with the higher assumed wind speeds in Hughes’ computer model. Hughes defends his approach by saying that it produces the best statistical fit. Critics have commented that any computer simulation that plugs in an assumed rise in national wind speeds that has not actually occurred is clearly inadequate.

Staffell and Green’s detailed analysis shows that turbine performance takes a dive in the last year or so before ‘repowering’, or the replacement of an old machine with a newer, and often much bigger, version. This is also consistent with the real world experience of wind farm owners who reduce maintenance as the wind turbines approach the point of being taken down. It’s far cheaper to repair old machines on the ground prior to reselling them into the second hand market.

The implications of this new study are important. Surprisingly, the financial models used by investors to plan wind farms seem to generally exclude any figure for performance degradation. The loss of power output in later years raises the cost of electricity derived from the turbines. The increment is small – no more than 9% - but it needs to be factored into the calculations about the true cost of wind power.

This isn’t necessarily a comfortable finding to financial people who had assumed that wind turbines had no perceptible performance decline. But Staffell and Green’s comprehensive and lucid work will for the first time provide the industry – and society at large – with proper estimates of the lifetime power output of a wind farm. And, as Gordon Hughes originally suggested, it will mean that a bigger than expected fleet of wind turbines will be needed to provide the UK’s desired electricity output from this source. If the UK does achieve 30 GW of wind power by 2020 - an increasingly unlikely target as offshore operators rapidly retreat from their projects - this will mean installing an extra 435 MW a year, or four large new farms, to counteract the ageing of the fleet.


(1) A turbine's capacity factor is its actual output as a percentage of its maximum yearly production if the wind were to be blowing strongly all the time.

A cheap and effective form of house insulation?

chimney sweepSally Philips, the inventor of the Chimney Sheep (www.chimneysweep.co.uk), sent me the following email over the weekend. I think that Sally's story clearly illustrates the challenges that energy efficiency entrepreneurs face. Although her product offers savings that match other improvements, such as better loft insulation, entrepreneurs like her face difficult obstacles in getting their product accepted by regulatory bodies. Products that improve air tightness are vital additions to the armoury of energy efficiency inventions but never get the attention that they deserve. (Her letter is reprinted with her permission). ***

Hi Chris,

I was interested to read the Guardian article recently ('The energy efficiency 'savings' that are just hot air') that referred to your blog.

I have developed a draught excluder for chimneys made of felted sheep wool. We lose about 4% of our household heat up redundant chimney flues. About two thirds of the UK housing stock was constructed pre-1970’s before central heating was installed as standard, meaning millions of UK homes have open chimneys, many of them with several. Plugging the gap with a Chimney Sheep saves about £64 per year, according to recent research conducted by the University of Liverpool:

http://www.chimneysheep.co.uk/pdf/University_of_Liverpool_efficacy_report_September_2013.pdf

I don’t know why the issue of heat loss up chimneys is completely ignored by the industry, by DECC, by EST…nobody takes it seriously but it is a problem that affects a significant number of homes and is so readily resolved.

I actually won a Green Economy Award in a category that was sponsored by DECC but nothing has happened as a consequence.

BRE estimate that 40 cubic metres of air is drawn up an open chimney flue per hour. I asked them to look at my product as the first step to getting it approved by OFGEM to be used as an ECO product. They calculated its performance in SAP, then told me that SAP assumes a closed flue is still 50% open to allow for ventilation. This isn’t a building regulations requirement so I don’t know how they can still use that calculation but they have and are now charging £5K for a report that shows that the product is half efficient!

HMRC said they would be happy to add my product to the list of insulation / draught exclusion products that are eligible for 5% VAT rate but I would have to get the law changed first. I met my MP who wrote a few letters to people who haven’t written back.

To be a member of the National Insulation Association I need a test that costs £15K.

To be listed among the products that are eligible to be used for ECO measures I need a different test that costs £15K. To be endorsed by EST I need another test that costs £5K

I’m not getting in touch just to have a moan, but I thought you might be interested to know just how hard it is to get the issue of chimney insulation noticed or taken seriously, when such a tremendous lot of heat is wasted up chimneys and it is so easy to prevent.

Yours sincerely

Sally Phillips

Chimney Sheep Ltd

19K Solway Industrial Estate

Maryport

Cumbria

CA15 8NF


Web: www.chimneysheep.co.uk

Phone: 01900 825019

Facebook www.facebook.com/chimneysheep

Green Deal promises break laws of physics

I’m not sure that the Green Deal needs any more kicking than it is getting at the moment. But, as one illustration of why I want it buried quickly, here are four sentences from the recommendations produced in the Green Deal assessment for my house in August of last year.  

‘Based on this assessment, your home currently produces approximately 1.7 tonnes of carbon dioxide a year.... Adopting the recommendations in this report can reduce emissions and protect the environment. If you were to install these recommendations, you could reduce this amount by 2.1 tonnes per year. You could reduce emissions even more by switching to renewable energy sources’.


In other words, the very nice assessor was promising me the very first carbon negative house in the world, without even using renewable energy. A world first and all by simply installing a bit more insulation! I think I am right in saying that this would break the laws of thermodynamics. That, and the several dozen other errors in the software that drives the Green Deal process, mean that people are systematically being offered inaccurate, expensive and utterly confusing advice in their assessments.

Actual energy savings from efficiency measures only half what is officially claimed

(This article provided some of the data for the Guardian's article on energy efficiency on 18.01.14. I have put it at the top of this web site in order to make it easy to find. Chris Goodall)  

Research published by DECC last month showed that home insulation measures deliver half the savings that are claimed. A study of homeowners installing a package of cavity and loft insulation and a new boiler in 2010 indicated a 19% reduction in energy use, and a likely saving of about £140 at current gas prices. The government’s Energy Saving Trust claims savings from these measures of twice this amount. The smaller than expected reductions in energy use mean that the typical UK householder will lose hundreds of pounds a year from taking out a Green Deal loan.

The research

The DECC study is part of a long running research project to track energy use in British homes. Actual gas and electricity use is logged for a large sample of households. Homes installing energy efficiency measures under government schemes can be compared to a control group of houses with initially identical gas and electricity consumption.

The results released on 21st November tracked those homes that had cavity wall insulation, loft insulation or a new boiler installed in 2010. The numbers showed the reductions in energy use in 2011 in these houses. Energy use in UK houses is tending to fall so the DECC survey  estimates the extra reduction in gas bills arising from the energy efficiency measures compared to the control group average.

The results

The table below gives DECC’s estimate of the cut in energy consumption arising from the individual reduction measures

Measure Percentage reduction in gas use Estimate of kilowatt hours of gas saved
New boiler 9.2% 1,800 kWh
Cavity wall insulation 7.8% 1,400 kWh
Loft insulation 1.7% 400 kWh


Notes:

a)       Loft measures include full insulation where the house had none laid and also ‘top-up’ measures to take the depth to 270mm.

b)       The homes having, for example, new boilers would have had a different control group to the cavity wall houses. So the baseline energy consumption may well be different.

c)        The average (mean) gas consumption across all the houses in DECC database was 14,100 kWh in 2011.

d)       By coincidence, those homes installing all three measures together achieved a saving of 19.0%, almost exactly the same as the individual elements combined.


At today’s gas prices, what are these savings worth? (I have used the lowest Big Six energy company costs of 3.874p per kWh for an address in Oxford). And what does the government’s Energy Saving Trust say that the measures should save a householder?


Measure Annual value of savings EST estimate of savings
New boiler £69.73 ‘£105 to £310’ depending on the age of the replaced boiler
Cavity wall insulation £54.24 ‘up to £140’
Loft insulation £15.50 ‘up to £180’ when loft had no insulation otherwise ‘£25’.


The DECC survey also looks at homes that had all three measures installed in the same year. The typical saving was 3,600 kWh, producing a saving in 2013 prices of £139.46. This compares with the EST’s headline saving estimate of £270, almost as twice as much as actually achieved. (I have used the EST’s figure of ‘up to £140’ for cavity wall insulation.

What would this package of measures cost today? The EST web site gives a minimum figure of £3,050. In other words, the typical return to energy efficiency investment is less than 5% per annum. (£139.46/£3,050) It may still make sense financially in these times of low interest rates on savings but the benefits are not large in cash terms.

The DECC study also shows that many households saw an increase, not a decrease, in their gas consumption after installing cavity wall insulation. The report doesn’t provide a number but a chart (Figure 3.3) suggests that perhaps 40% of homes with new insulation experienced increased bills compared to the control group. This may be because the insulation was installed badly - a depressingly common phenomenon - or because the occupants decided to heat their house to a higher temperature as a result of the better insulation.

The implications for the Green Deal, the government’s main energy efficiency policy, are very troubling indeed. Unsurprisingly, the DECC statistical report doesn’t make this clear.  The Green Deal arranges for householders to get loans to improve their properties. The interest is charged at commercial rates and repayment is made through the electricity bill.

According to the EST figures, the typical householder installing loft and cavity insulation and a new boiler would need to take out a loan of about £3,050 to pay for the measures. At an interest rate of 8% and repayment over 20 years, the annual addition to the electricity bill would be £342.87, compared to the average savings on the gas bill of £139.46. In other words, a family taking out Green Deal finance would be over £200 a year worse off as a result of doing what the government suggests and improving the energy efficiency of their home.

Outside government, everybody knows the Green Deal is a disaster. The scheme is excessively complicated, over-bureaucratic and expensive. The initial assessments for the programme use software that is misleading, and often simply wrong, in its estimates of cost savings from energy efficiency. (I know; I had one done on my house).

More generally, I want to ask this question. If the research arm of DECC knows the true figure for the likely cost savings from energy efficiency  measures, why are other parts of government continuing to promulgate much larger figures in order to get householders to take out Green Deals? When is DECC going to get sued for not telling people trying their best to save money that the Green Deal will typically cost families hundreds of pounds a year?


Power to the people: Islay looks set for a hugely successful community turbine

Visualisation of how the turbine will look Local investors have put over £150,000 into the Islay community wind turbine in the first 48 hours of a share offer.  Islay, an island off the west coast of southern Scotland, looks set to join nearby Tiree, Gigha and Westray in the growing list of areas developing, funding and owning their own energy resources and using the financial surplus to reduce energy consumption in their homes and community buildings.

Islay is one of the windiest places in the UK. A commercially owned turbine on the island would make a very decent return. In this case, however, the community has decided to hold the interest paid to individual investors at 4% and will hand the remaining profits to a fund to improve local energy efficiency and relieve fuel poverty. The illustrations in the fundraising prospectus show about £80,000 a year flowing to these causes. Among many other advantages, this has ensured very wide support for the turbine. A 2011 survey suggested 92% of the island’s residents were in favour of the project.IMG00151-20121121-1245

The Islay cooperative (strictly speaking an ‘industrial and provident society for the benefit of the community’) is promised loans and other support from the Scottish government and other institutions if it fails to raise its target of around £750,000 investment from individuals. But if the cash keeps on flowing in at the rate of the first 48 hours it won’t need the money. The total cost of the project to install the Enercon 330kW turbine is around £1.25 million, a high figure inflated by the substantial costs to reinforce the electricity grid.

The output of the turbine will be about 1,000 MWh a year, enough to cover the needs of about 300 homes, or about a fifth of local domestic needs. In addition, of course, the local whisky distilleries need power, which is partly provided by anaerobic digestion plants on the island.

Speaking personally, I find Islay’s success hugely cheering. Although it should be acknowledged that getting to £150,000 outside investment is made relatively easy by the generous tax reliefs available to the first investors in the project, the degree of enthusiasm for this project is striking. Like the Osney hydro installation on the Thames, Islay shows that a well-planned scheme led by local people and with robust philanthropic intent can raise money at 4% (plus some benefit from tax relief) and still devote the bulk of its return to improving the lives of a wide spectrum of the community. We need hundreds of thousands of schemes like this.

Southern Hebrides including Islay

One response to my zeal for projects like this is to comment that they are only possible because of the generosity of feed-in tariffs. And these feed-in tariffs are (slightly) inflating the bills of everybody else. It’s true that medium sized wind turbines on windy sites can make high returns with the subsidies currently available. However the really interesting thing is that individual investors are prepared to take a far lower return from community energy projects than is required by commercial operators.  People are happy with 4% interest; companies need 10% or more. In the long run, the switch to local ownership will reduce the bills paid by everybody because of what finance people call a lower ‘cost of capital’ for energy projects owned by individuals, not corporations. Perhaps as importantly, the Islay people will target the surplus money far more efficiently towards genuinely worthwhile local energy-saving projects. We’ll see far lower costs to reduce fuel poverty if the money is generated and allocated by local people than if it is done to meet the targets imposed on the Big Six.

The Germans in the unusual role of impractical dreamers

We Brits haven’t properly understood the scale of the German Energiewende, or energy transition. A recent seminar at Germany’s Environment Agency (Umwelt Bundesamt or UBA) assessed whether the country could stop using fossil fuels entirely by 2050 and concluded it is technically feasible to produce all the country’s energy (and not just electricity) from renewable sources without using biomass, nuclear or carbon capture. This would mean generating about 3,000 terawatt hours (TWh) of renewable electricity and converting most of this into methane (Power to Gas) or methanol/butanol (Power to Liquid).  This is six times current electricity generation from all sources. And it assumes a 50% reduction in Germany's total energy use. Are they mad? I think they probably are. But Germany society is strongly behind the Energiewende and we shouldn’t underestimate the ability of a determined, resourceful and technologically sophisticated country to achieve almost unimaginable growth in renewable energy. What looks to us like impractical dreaming may eventually work. 

Looked at as a multiple of existing low carbon generation, the target numbers are even more startling. In 2013, German wind produced 47 TWh and solar 30 TWh. Hydro added a further 15 TWh. In total, these renewable sources provided 92 TWh, or about 3% of what the Agency says will be needed to decarbonise the economy in 2050. Large scale expansion of hydro power is not an option. So wind and solar will have to be expanded about 40 fold to cover all the country’s energy needs.

It should be said that the UBA seminar papers avoided any detailed discussion of how the country will grow PV and wind to meet the huge need for electricity at mid-century. A 40 fold expansion of PV would mean that over half of German grassland would carry photovoltaic panels but nobody mentioned this. Of course some energy can be imported, but since most other countries in Europe will attempting their own form of Energiewende there won’t be much surplus to go around.

The nature of the ambition.

The UBA seems to have decided that a low-carbon future critically depends on using electricity to completely replace gas and motor fuels. Whereas the UK talks of converting to electric cars and using electric heat pumps to provide home heating, Germany is committing to using power as the raw material for renewable methane and for renewable liquid fuels. (Older articles on this web site have looked at the reasons why the natural gas grid is the only conceivable way of storing surplus electricity generated on very windy days).

One paper at the symposium examined the relative storage capacities of the existing electricity system in Germany (this is almost entirely hydro-electric power schemes that pump water uphill when the grid is in surplus and then let it flow down again at times of shortage) and compared it with gas and oil storage networks.

German primary and final consumption

The argument is compelling: large scale seasonal storage of electricity can only be achieved by converting power into gas, through electrolysis and methanation, or into methanol/butanol using similar processes. Whatever advances we can possibly expect in batteries or other conventional technologies won't provide more than a tiny fraction of the energy storage we will need. Complete decarbonisation, the UBA seems to be saying, will need huge investment in today’s nascent power to gas and power to liquids technologies.

The graphic below makes repeated appearance in the symposium papers.

specht graphic

To replace all carbon fuels with renewable electricity, much of it converted to other energy carriers, necessarily involves large conversion losses. Turning surplus power into methane, and then burning it a gas-fired power station to regenerate electricity, recreates less than a third of the original energy. But if an advanced society, such as Germany or the UK, really wants to decarbonise, there really is very little choice. We have to accept the wastage of energy entailed because intermittent renewables will otherwise need huge backup from fossil fuels.

The scale of what is envisaged

The seminar saw estimates of the amount of primary energy needed to create the fuels a modern economy requires. The table below gives the figures.


Primary energy needed Final energy created from this
Electricity 550 TWh 460 TWh (1)
Gas 1110 TWh 300 TWh
Liquid fuels 1280 TWh 520 TWh

 (1)      For electricity, the difference between primary and final energy arises from grid losses and from the losses in pumped hydro and in using some electricity for making methane, prior to conversion back to electricity.

The Germans are saying no to nuclear, but also to CCS and biomass. In one paper from a UBA employee, CCS is called ‘unsustainable’, an attitude remarkably at variance with the UK position. Biofuels of all forms are rejected for similar reasons. So all energy (not just electricity) comes from renewables in 2050 and the UBA sees PV and wind as being the dominant source. The need is for almost 3,000 Terawatt hours of electricity to provide this.

Today Germany has 36 GW of PV, compared to around 3 in the UK. This technology 5.3% of total electricity production in 2013. Wind power supplied about 8% of all electricity need from 33 GW of turbines, about four times the UK’s capacity.

To supply just Germany’s current electricity demand, not the total energy need that the UBA suggests, would need a sevenfold increase in turbines and solar panels. This is not impossible, particularly if Germany successfully moves into offshore wind, which is currently a negligible fraction of its wind capacity. But can Germany reasonably aim to then increase renewable electricity a further six fold to produce the power for methane and butanol production as well? I’m sceptical.

There’s one other important point. Whether or not Germany achieves the ambition of 100% renewable energy, avoiding biofuels and other questionable sources, it is now very focused on developing conversion technologies that turn large volumes of electricity into gas and liquid energy carriers. There is no discussion whatsoever of this in the UK. Time to start learning from the German focus on this critically important issue?


Reducing draughts: a national competition to show how much can be saved

The latest government data shows that draughts cause about 25% of all heat loss from the average house. That means that a quarter of the household gas bill is disappearing through such places as cracks in doors, holes around water pipes and the gaps around window frames. Reducing losses through ventilation is fiddly. It requires perseverance and care. Nevertheless, the savings can be large at a minimal cost. As the Green Deal unravels, we need a new national programme to improve house insulation standards: draught-proofing is the obvious target. The return on investment is likely to exceed all other energy saving initiatives.

Here is my proposal. I suggest a national competition, run by an institution such as the Building Research Establishment (BRE), challenging home insulation companies to reduce draughts in a number of pre-selected homes. It’s possible to accurately measure the draughts in a house before and after insulation and the winner would be the company that cut heat loss the most. It would be finicky, laborious work but it would demonstrate the value of careful draught-proofing. Perhaps each competitor would be given two working days per house and might be asked to work on five houses to prove their skills. Most amateur draught-proofing work isn’t particularly effective but shown the way we could all improve our appalling leaky homes.

In the government’s compendious and fascinating ‘Housing Energy Fact File’ has a table that estimates the actual heat losses from the components of a typical home. For every degree that the home is maintained above the external temperature, the house loses 287 watts of heat. So keeping the home at an average of 18 degrees when it’s -2 outside requires heating that provides about 5,740 watts, or 5.74 kilowatts.

The walls are most important drain of heat. About 32% of all heat leaves this way. What are called ‘ventilation’ losses are next at about 25%. This is 50% more than the windows and three times as much as the roof.

heat losses from house

These figures are for the average house. For a home with good cavity insulation, the loss from draughts might actually exceed the loss through the external walls. To put a monetary value on this, let’s assume that the average house uses about 12,000 kWh of heating per year. 3,000 kWh of this needed to replace the heat lost through draughts, and this will cost around £120 at current prices. Saving a good fraction of this by better draught-proofing is cheaper, quicker, less disruptive and more fun than wall insulation or getting into the loft to roll out some another bale of fluffy mineral wool. It may be actually more effective as well: a previous article on this web site showed that major measures such as cavity wall insulation saved much less energy than predicted.

And, perhaps as importantly, reducing draughts around the house will improve perceived internal temperature. Draughts moving across the skin suck heat out of the body faster than still air does so a still house will seem to be a warmer house.

Current UK building regulations require a new house to lose less than 10 cubic metres of air per square metre of external surface area an hour at a standard pressure difference (50 pascals, if you want to know, which is an order of magnitude more than the normal gradient) between the inside and the outside. This will usually mean hundreds of cubic metres of expensively warmed air are being lost every hour. Put another way, all added together the average new house is said to have gaps the total size of a basketball. (I don’t have the data to back this comment up, by the way).

Everybody knows about the leaks that arise because the door doesn’t fit properly, or the windows that have a gap around the edge. It’s easy to deal with this with some cheap insulating tape bought from a DIY store. Applied carefully, this will make some difference. The real gaps are probably less visible. They occur where water or waste pipes go through walls, where light fittings meet the ceiling or skirting boards touch the floor. Filling these gaps is not difficult and nor does it require expensive materials. But it is time-consuming and requires punctilious care. The photograph below is from a Strome presentation on sources of heat losses in new UK houses. Finding and filling gaps like this is difficult work if it is to be done well.

Holes behind sink

This is presumably why home improvement programmes such as the Green Deal focus on expensive but standard suggestions such as changing the boiler or putting up solar panels.

None of us really know how to improve all aspects of draught proofing. Which of us has looked carefully behind the loo to see if there are gaps in the cement, or gone under the kitchen sink to see if hole through which the cold water comes into the house is sealed? These are where the biggest savings are likely to be.

I think we should have a competition to see who can improve houses by the largest amount. The competition can be documented and filmed. The winner would be the company or person that cut draughts the most (measured in the reduction in air leakage per hour). The competitors could use equipment such as infra-red thermometers or smoke pens. (A pen that issues smoke so that the observer can see where the draughts are).

Smoke pen

We cannot predict what the savings are likely to be. Cavity wall insulation saves an average of 1,400 kWh a year, reducing bills by £56 or so. Really good draught-proofing might do better. But the cost might be a third or less. And the impact on perceived warmth might be greater.

Too many government energy efficiency initiatives are not backed by hard information about their true effectiveness. Air source heat pumps are a prime example. I believe a big national competition to crown the best draught-proofer, run by the Building Research Establishment over a long weekend, would attract attention, help build understanding and provide some real numbers about the benefits of careful plugging of leaks from domestic homes. As the Green Deal dies a death and takes the UK insulation industry with it, a new campaign to reduce heat losses might provide some much needed alternative employment.


Response from Professor Gordon Hughes to previous posting

(Professor Hughes has very kindly provided a response to a recent posting on this site. (Electricity output figures show wind turbine performance deteriorates very slowly with age). The original article was also carried on other web sites and Professor Hughes refers to the title and date of publication on the Ecologist blog. My reply to Professor Hughes is carried as a comment below his text.)  

Wind Turbine Performance Over Time: A Response to Chris Goodall


In his blog published on 03.01.14, “Wind turbines – Going strong 20 years on”,[1] Chris Goodall argues that the degradation in the performance of wind turbines with age is much lower than reported in my 2012 study The Performance of Wind Turbines in the United Kingdom and Denmark.[2] The following note explains why I believe that my conclusions are sound.

Mr Goodall has kindly provided me with the data to which he refers to in his work. With the exception of a long series for Delabole wind farm, Mr Goodall’s data is a small subset of the much larger sample of wind farms, several hundred in fact, analysed in my original study. Mr Goodall’s data also adds a few monthly observations that were missing when my data was originally extracted from the source database. Overall, Mr Goodall’s data amount to about 5% of the data that I analysed, and where he has new material it adds very little.

Furthermore, Mr Goodall himself very frankly admits that he does not have the statistical skills required to replicate the methods of my analysis. His work does not constitute a reanalysis or a rebuttal of my paper. In fact, his calculations simply reproduce one feature of the results reported in my paper.  There was a generation of wind farms developed in the early 1990s, both in Denmark and the UK, using turbines of less than 0.5 MW which have experienced a relatively limited decline in performance with age.  By focusing exclusively on these wind farms, Mr Goodall misses the bigger picture.  The performance of wind farms developed from the mid-1990s onward is much worse.  The average size of the turbines and the wind farms increased.  The larger turbines appear to have been less reliable, while my analysis suggests that the siting and maintenance of wind farms may have deteriorated.

Mr Goodall concludes with two challenges/questions which are representative of many comments on my work.  They spring from a lack of understanding of the statistical reasoning involved.  I will begin with his second question, since it is central to the analysis. Mr Goodall wonders how it is possible to estimate the decline of load factors over time when we have less than twenty years of data for any wind farm. This is where the mathematical/statistical specification described in the Appendix to my paper is crucial.

The load factor for any wind farm in any period is expressed as the sum (or product in the multiplicative version) of components associated with the age of the wind farm (held constant over all wind farms of the same age), the period (constant over all wind farms in one period), the site of the wind farm (constant over time and age), and a random error. This is a standard formulation used by statisticians, including for the analysis of data from a wide range of medical and biological trials. The age effects can be identified from the variation in output across wind farms of different ages for each month. So long as each wind farm is tracked for a number of periods, the site characteristics of the wind farm can be separated from age effects which are common to all wind farms of the same age.

In his first question, Mr Goodall challenges me to produce a counter-example to the case of Delabole, which he claims demonstrates a much lower rate of degradation with age than that reported in my paper (in fact it is similar to the overall rate I report for Denmark). This is a recurrent theme among critics of my work. As an argument it is equivalent to someone claiming that smoking cannot harm anyone’s health because their “Uncle Jack” has smoked a pack a day for 60 years and is still fit and well at an age of 80. Of course there are apparent counter examples, and these can be found in the REF load factor database: www.ref.org.uk. It would be invidious to name them, and in any case they no more prove my analysis than Delabole disproves it. Individual cases prove nothing about population epidemiology, a point which is as true for wind power as for public health. The proof is in the statistical analysis itself.

As a separate point, I am struck by how selectively critics report the results of my work. As noted above, the experience of Delabole and other wind farms built in the period 1991-93 is consistent with my analysis of wind farms in Denmark, where load factors seem to decline more gently with age. That may reflect the robustness of wind turbines built in the early 1990s, site choice, how they have been maintained, and other factors. For the avoidance of doubt, I do not argue that the performance of wind farms must, inevitably, degrade rapidly with time. My observation is that the average performance of wind farms in the UK has, as a matter of fact, fallen as they have aged, a fact that is probably the result of both the physical characteristics of wind power and the economic characteristics of the financial incentive regime, the Renewables Obligation subsidy.

My results have important and obvious implications for both investors and policymakers. But the response of advocates of wind power is rather interesting. For the most part, it has involved an attempt to shoot the messenger rather than trying to understand the underlying phenomena. Yet, none of the statistical analyses of my or other data have demonstrated that there is no degradation in performance in age. The issue is not whether degradation occurs, but how much. There can be reasonable disagreement about that, as the comparison between Denmark and the UK illustrates (which is why I included that in my original study). The key point is to identify the causes of changes in load factors over time revealed by statistical analysis, and whether and how these may be addressed.

The willingness of the owner/operator of Delabole to provide unpublished data on output from the wind farm is to be commended, but, though welcome, it is only a small step in the right direction. Any investigation in this area is hampered by the unwillingness of operators to provide the wind speed data collected by the anemometers which are installed at all wind farms. Let me briefly indicate why this matters. One explanation for performance degradation over time would be an increasing frequency (or length) of mechanical failures of turbines. An alternative explanation is that the power curve (the relationship between wind speed and power output) changes due to gradual erosion of the blades, a phenomenon well known in the industry. An assessment of the relative contribution of these – and other – factors can be used to improve both turbine designs and maintenance regimes for existing wind farms, but such work cannot happen until the anemometry data from individual wind farms is made publicly available.

An ostrich-like approach of denying that there is a problem helps no-one. A lack of transparency leads to the suspicion that wind operators are unwilling to be accountable for the large sums of public money which they are currently receiving, and certainly makes it difficult to ensure that subsidy policies give good value for money to the consumers who foot the bill. But even the wind industry does not benefit in the long run, because it is foregoing the opportunity to learn from and build on the lessons from detailed analysis of performance.

Gordon Hughes

05.01.14

About the Author

Dr Gordon Hughes is a Professor of Economics at the University of Edinburgh, where he teaches courses in the Economics of Natural Resources and Public Economics. He was senior adviser on energy and environmental policy at the World Bank until 2001.


[1]http://www.theecologist.org/blogs_and_comments/commentators/2221532/wind_turbines_going_strong_20_years_on.html

[2] Gordon Hughes, The Performance of Wind Turbines in the United Kingdom and Denmark (Renewable Energy Foundation: London, 2012). Available for download at www.ref.org.uk.

Electricity output figures show wind turbine performance deteriorates very slowly with age

I wrote a few weeks ago about the surprising assertion from the Renewable Energy Foundation (REF) that the performance of wind farms declines rapidly with age. A study carried out by Professor Gordon Hughes for the REF in 2012 suggested that ‘The normalised load factor for UK onshore wind farms declines from a peak of about 24% at age 1 to 15% at age 10 and 11% at age 15’. To put this in everyday English, Professor Hughes is saying that a 15 year old onshore wind farm will typically produce less than half its initial output of electricity. Few people in the industry would demur from a conclusion that wind farms very gradually lose output but none accepted Hughes’s finding that electricity generation falls at anything like the rate he stated. If true, his finding would have serious implications, as the REF was keen to point out. To achieve the UK’s targets for wind-generated electricity, we would have to put more turbines on the ground because ageing wind farms would produce much less power than expected. This is an important topic and I thought it needed more examination.

After meeting REF in early 2013, DECC Chief Scientist David MacKay responded to the study, eventually publicly saying that Hughes’ work had serious statistical flaws. REF has recently rebutted Professor MacKay’s comments saying, with some asperity, that his actions are ‘extraordinary’ and impugning his understanding of econometrics.

Few of us have the detailed knowledge of statistics to say whether Hughes’ conclusions follow from the data he has used. I thought it might therefore be helpful if I analysed the individual performance of all the UK’s oldest wind farms. I’ve looked at the data on the output of 14 farms, all established in the period 1991 to 1993. I’ve been particularly helped by the assistance of Peter Edwards, the entrepreneur behind Delabole, the Cornish wind farm that started the UK’s commercial exploitation of wind for the purpose of generating electricity in December 1991.

Hughes’ study contained no assessment of the performance of specific wind farms. All the data was merged into one large statistical series. On the basis of my assessment of actual production data from the earliest farms – all but two of which are still operating with the initial turbines – I want to suggest that the empirical evidence strongly suggests that Professor Hughes greatly exaggerates the rate of performance decline. None of the 14 wind farms shows ageing effects more than a small fraction of the figures he quotes. Investors and the general public can be confident that performance degradation is not a large problem.

Method

I have two sources of data. First – with many thanks to Peter Edwards – I have the yearly output figures from Delabole from 1992 until the farm was ‘repowered’ with new, much larger, turbines in mid 2010 after nearly twenty years of production.

Second, I have the numbers from Ofgem’s database on the output of renewable generators. These numbers only go back to April 2002. (I have no idea how Professor Hughes could possibly have calculated the rates of decline of electricity output of twenty year old turbines when – at most – he only had ten years of figures).

We also have information on the average performance of UK onshore commercial wind turbines. DECC publishes a yearly estimate of the ‘load factor’ of existing wind farms. (The ‘load factor’ is the percentage of maximum yearly output actually achieved). Load factors vary – principally in response to average wind speeds. Professor Hughes’ work suggests that after accounting for wind speed variations load factors fall every year from the moment a new turbine is installed. This is what I wanted to check using real world data.

Delabole

Chart 1 shows the yearly output from this Cornish wind farm from 1992 to 2009. (The repowering process started in mid 2010 so later output figures are not available).

Peter Edwards commented to me that the reason the 2009 figures appear to show a drop is that the operators of the wind farm (by then it was the utility Good Energy) decided it wasn’t worth replacing a gearbox because the turbines were scheduled to be taken down in less than a year’s time.

But even with the lower level of output in 2009, the average yearly decline was only  about 0.8% of output, not the 5% estimated by Professor Hughes. [1]2009 electricity production from turbines that were then 18 years old was 85% of the first year’s figure. In 2008 – when the turbines were still being actively repaired – Delabole recorded electricity generation of 99.6% of its initial annual output. Rather than output being more than halved, performance had fallen by a few megawatt hours a year.

Chart 1

Delabole 1

I don’t have UK average ‘load factors’ before 2001. Chart 2 shows how Delabole compared to the typical onshore wind farm in the years between 2001 and 2009. On average it was slightly lower, with a more marked difference in 2009 because of the lack of repairs to gearboxes. But the differences are small and there certainly isn’t any obvious sign that the performance was degrading against the UK average.

Chart 2

Delabole load factors


The oldest UK wind farms

If Hughes is right, then the oldest turbines should be very much less productive than the average UK figures. Of course wind farms established in the early 1990s might have been placed in particularly wind locations which might push their outputs upward. Balancing this, newer wind turbines could be expected to be better designed, and able to turn more of the energy from wind into useful electricity.

Chart 3 shows that the 14 oldest wind farms have load factors slightly below the UK average for the years 2001 to 2011. But there is no evidence of any widening of the differences. And, most importantly, the absolute level of output of these geriatric turbines is very much higher than Professor Hughes said. He wrote that turbines in their fifteenth year of operation should typically produce 11% load factors. In fact, these elderly wind farms – all of which were over eighteen years old in 2011 –  had average load factors of well over twice Hughes’ predicted output. They seem to have suffered more than expected in the historically highly unusual low wind speed year of 2010. (I suspect this is a consequence of better engineering for low air flows in newer turbine designs). But otherwise performance shows no relative decline from a decade ago.

Chart 3

load factors for pre 1994 and all wind farms


One last request. Anybody in active communication with Professor Hughes might want to ask him two questions. First, can he show us any individual wind farms that demonstrate the rate of deterioration his forecasts suggest? There were about 380 onshore wind farms recorded in 2012. The oldest 14 show nothing like the signs of ageing that Hughes grimly forecasts. Do any others? Are there any examples of farms whose wind-speed adjusted output has actually fallen 5% a year as he predicts?

Second, given that the outputs from wind farms are only publicly available from 2002, how is the Professor able to estimate exactly what the rate of decline in output of a twenty year wind farm is likely to have been? Because of Peter Edwards’ generosity in releasing Delabole figures to me, I can show that the decline of that single farm’s output is nothing like Hughes’s statistical forecasts. How did the Professor get to his numbers when he only had – at most – ten year’s data available for all the rest of the UK’s fleet of turbines?


(Please write to me if you are interested in seeing the data I used).


[1] This is estimated using simple linear regression.

[2] These calculations exclude Delabole and Goonhilly wind farms for the years after mid 2010, when both were repowered with new turbines. The other farms have unchanged configurations. The load factor I have used for the UK as a whole is also on an 'unchanged configuration' basis.

Air travel forecasts have been cut by 35% in the last six years. Why do we believe today's numbers?

In the last six years the government has produced four different forecasts for air passenger numbers. Each successive estimate has been substantially lower than the last. In January of this year the Department of Transport published an estimate of 315m passengers in 2030 compared to a figure of 480m in November 2007, just fifty months earlier. As the UK starts a new round of animated discussion about expanding Heathrow we might bear in mind that forecasts for air travel have been consistently too high in recent years, even for the immediate future. 2009 estimates about travel numbers in the following year were over 15% too high.

Today's report from Howard Davies' Airport Commission proudly boasts that its forecasts - which are broadly the same as those of the 2013 Department for Transport figures - have a far lower margin of error than all previous estimates. (Please see figure 4.3 in the Davies report). They are more certain than ever of the accuracy of their central forecast. In the face of the huge and completely unpredicted reduction in forecast demand for aviation over the last six years, isn't about time that we considered the possibility that the need for aviation has begun to stagnate?

(Past articles on the troubled logic behind Heathrow expansion plans are here, here and here.)

Whether or not the UK needs new runways depends almost exclusively on future demand for air travel. The five decades between 1950 and 2000 saw typical growth of nearly five per cent a year. However 2012 passenger numbers were no higher than in 2005. Is this effect of economic difficulties around the world or does it represent a clear sign of a maturing market? The Department for Transport thinks growth will return once economic difficulties are behind the UK. But it has nevertheless sharply cut its forecasts since 2007. This year’s estimates are a third lower than those provided just fifty months ago. Travel numbers are expected to be permanently lower than they were.

Forecasts of number of passengers using UK airports, millions per year

 Air travel forecasts

Source: Department for Transport forecasts

Are the new lower forecasts likely to be accurate? Or have we reached peak air travel in the same way as we are experiencing a plateau in the needs for surface transport? The latest estimate suggests a 40% rise in air travel in the next seventeen years, an increase of over 2% a year. As real incomes continue to fall, I think the Department for Transport is probably still being too bullish. Basing the case for a third runway at Heathrow on forecasting techniques that have proved spectacularly wrong in the last half decade looks a little foolish to me.


Another nail in the coffin of econometrics: Gordon Hughes and the abuse of statistics

It was the proud boast of an econometrician I knew that he could ‘prove’ anything using statistics. He would have loved Gordon Hughes’ 2012 paper on the effect of age on the output of wind turbines. Hughes produced figures suggesting that the typical electricity generation of a UK onshore turbine falls sharply ever year of its life. He says the average load factor of a new wind farm starts at about 25% and is down to below 5% within scarcely more than a decade. Econometrician Hughes never seemed to talk to any operators of wind farms, who would have corrected his wild statistics. Nor did his paper actually provide us with the output figures from any individual turbines. Nevertheless, this didn’t stop his extraordinary analysis from getting substantial coverage. Yesterday Professor David MacKay, chief scientist at DECC, weighed in against Hughes’ conclusions. For those whose eyes start going round in circles when faced with equations like those in MacKay’s short article, let me provide one chart from Hughes’ paper which might help convince you that wind turbines don’t actually age faster than domestic cats.

In this chart, taken directly from the paper, Professor Hughes plots the average ‘capacity factor’ of turbines split by the age of the wind farm. (The ‘capacity factor’ is the percentage of the maximum output of a wind farm actually achieved in any year. For the UK onshore wind industry as a whole, capacity factor hover around 25-30%, depending on the strength of the winds in the year.)

Hughes

The centre line in the middle of the green box is the average for the turbines of that age. The length of the box reflects the degree of variation between the wind farms in that group. You’ll notice that the average capacity factor doesn't actually fall as the age of each cohort of turbines increases. 15 year old wind farms do as well as farms in their first year. This inconvenient data didn’t stop Hughes. He went into overdrive to show that old turbines fall apart. And there’s always a statistical technique to enable you to do this. And very few people like David MacKay able to say quite how inappropriate that technique is.

Just so you can be sure that Hughes’ conclusion that onshore wind turbines lose 85% of their power in fifteen years, here are the generation figures from the Baywind Cooperative in Cumbria. Yes, the first full year produced more electricity than last year, but 1998 and 1999 were year of some of the highest wind speeds in the last two decades. By contrast, 2010 had probably the lowest wind speeds since the second World War. Take out these data points and you’d be hard pressed to show any decrease in output.

baywind 3

Wind turbines probably do deteriorate over time. They are very complicated mechanical devices undergoing huge mechanical stresses. But the decline is small, fairly predictable and nothing like as sharp as Professor Hughes says. Hughes' work demeans his profession.


Government cuts its projections for offshore wind

The unrecognised implication of today’s announcement about the strike prices for low-carbon technologies is that the government has cut its ambition for the size of the UK offshore wind industry in 2020. A month ago it said that its delivery plan ‘indicated deployment of up to 16 gigawatts by 2020’. Today (4th December 2013) it says that ‘DECC modelling suggests that 10 gigawatts is achievable’ (My italics). It then backs off further, stating that the 10 GW figure ‘is not a target’ and that ‘actual deployment will depend on technology costs’. Perhaps as importantly, the government is now talking – albeit in very abstruse language – of reducing the strike prices of ‘mature technologies’ if and when they become too successful. In other words, the strike prices published today for PV and onshore wind are far from guaranteed. If, as I expect, developers put far more PV farms on the ground than DECC is forecasting, the prices paid will be reduced.

In their analysis of the strike prices, the media focused on the changes made since the draft figures were published in July 2013. Much was made of the increased price for offshore wind. This emphasis was wrong.

Strike prices for offshore wind/MWh

2014/15 2015/16 2016/17 2017/18 2018/19
Draft proposals £155 £155 £150 £140 £135
Decision £155 £155 £150 £140 £140
Difference £0 £0 £0 £0 +£5


Despite what the government wanted us to believe, this wasn’t the key difference  between July and now. Nor were the small, and unsurprising, reductions in subsidy for solar and onshore wind, and quite sharp cuts in landfill and sewage gas payments the critical new developments.

The real change is the major reduction in the degree of commitment to building a very large offshore wind industry. In the July draft document, offshore wind was ‘projected’ to reach 8 to 16 gigawatts by 2020. The July document goes on to say that ‘the upper end of this range is reached if costs come down to meet industry aspirations and there is some delay to nuclear and CCS’ (which there has been - no nuclear station will be built before 2023 at the earliest).  In November, the language was firmed up and ‘deployment of up to 16 GW by 2020’ was indicated in DECC’s published roadmap.

Today, we’re told that ’10 GW is achievable’, not ‘projected’ as it was earlier in the year. As a consequence, the target for the share of renewables in electricity generation is also softened. The final strike prices provide ‘a basis for renewable electricity to achieve at least 30% of generation by 2020’ DECC said. By contrast, the July projections told us that low carbon generation would actually represent 30-35% of all sources of electricity by 2020, not that it provided ‘a basis’ for achieving this target.

The other big change is in the language on ‘competition’. What DECC means by this is that if technologies start to look as if they will be too successful (and therefore absorb too much subsidy), then the government will conduct reverse auctions to drive down the strike price. The installations requiring the lowest prices will get the available pot of subsidy. This may well be a good idea but it is an idea entirely lacking from the July consultation. Of course the risk is that the benefit of a secure strike price – principally that it gives investors the confidence to spend millions in planning large wind or PV installations – will disappear if the price can actually change overnight.


A modest proposal to give away LED lights

I want to open discussion of a small and eccentric scheme to reduce emissions and household bills while slightly improving the UK’s energy security. My suggestion is that the UK gives every householder a voucher for 10 high efficiency LED lightbulbs. LEDs are now better, more long-lasting providers of light than traditional compact fluorescent bulbs and halogen spotlights. They are still expensive and takeup is quite slow. The payback for the average bulb is probably about four years and for most people this is too long. Free vouchers will change this. Giving every householder ten free bulbs would reduce bills by at least £20 a year and for some people much more. It would cut UK emissions by about half a percent and, importantly, should shave peak electricity demand by at least double this percentage.  I calculate the cost to be about £1.6bn, or slightly more than the much- disliked ECO scheme.

It could be restricted to those in fuel poverty, reducing the cost to a fraction of this amount.  The cost per tonne of carbon saved is approximately equivalent to other measures. The scheme is progressive because the benefits can be directed mostly to less well-off people.LED bulbs

In the last year, LEDs have come of age. The newest lamps now give the same quality of light as halogens and the old incandescent bulbs. They fire up immediately, unlike many compact fluorescents (CFLs). They last many tens of thousands of hours, or several years in continuous operation. They can be retrofitted in existing 12v and mains lamp fittings.

Although the price is coming down, they are still expensive. As a result, the big retailers still give LEDs relatively little space and don’t promote them heavily.

The most competitive online retailers are offering 12v halogen replacements at around £6 from unbranded suppliers. The products of the best-known manufacturers are two or three times as much.

A 7w LED can provide approximately as much light as a 35w halogen, a five to one improvement. All our lights will be LED at some point in the future. We need to accelerate the transition.

Electricity use in the home

In recent years the amount of electricity to use for lighting in the home has tended to fall. CFLs have reduced average energy used from about 700 kWh a household to around 500 kWh a year. This is still about a seventh of total residential demand.

Getting people to replace fridges or televisions with more energy-efficient models is difficult. Few people are going to trade in old, but functioning, washing machine because they might save £20 of electricity a year. Lights are different. The payback is much shorter and it is simple to take out one bulb and put in another.

There’s another reason for pushing this scheme. Lighting demand is at its peak just as the UK experiences its maximum electricity need at 5.15 on a December afternoon. The lights are still on in shops and offices and, in addition, most homes need lighting at this time. So quickening the slow process of switching to LEDs will help shave electricity demand, reducing the possibility of blackouts in future years. (When people speak of the ‘lights going out’, they refer to the possibility that the UK’s power generation capacity will not be able to meet this early evening weekday peak. There’s no possibility yet of more generalised power cuts at other times of the day.)

The cost

Giving 26 million homes a voucher for ten LEDs isn’t a trivial expense. But it is little more than the discredited ECO scheme and it will be much more effective. The voucher will be usable at any participating retailer (which might chose to take its wares door-to-door to offer customer a chance to pick the lights they want). I think retailers will be willing to accept £60 as the government payment for redeeming the voucher, or £6 a bulb. This implies a cost of about £1.6bn, perhaps spread over two fiscal years as ECO is.

The savings

I assume that the ten LEDs are all installed by the homeowner. The average light bulb in a high traffic location in the home is on for two hours a day. If we estimate that the ten LEDs are all in these locations and save an average of 25 watts, then the total yearly saving per household is about 150 kWh. The financial benefit is about £20 at today’s electricity prices, more in a home on Economy 7 tariffs.

The carbon saving is about 2 million tonnes a year, or 1/2% of the UK total.

We cannot accurately know how many of the bulbs will typically be in use when the early evening peak arrives. If this number is 50% of all the bulbs installed under this scheme, the likely saving is about half a gigawatt or just less than 1% of peak UK demand. This is about half the electricity provided by a large new gas-fired power station but, more importantly, it will make a significant improvement in the safety margin available to the National Grid.

The other changes that might spring from the scheme

Once householders have changed 10 bulbs successfully, they will be more likely to move on to convert their whole house. Then the savings might be three times as much. The example of the savings in domestic homes will tend to accelerate the remarkably slow switch to LEDs in shops and in commercial and public buildings.

A successful voucher scheme will make LEDs better known, increase retailer interest and encourage further innovation in design.

The impact on fuel poverty

Of course the impact of this scheme isn’t particularly significant. £20 for the average household is a small fraction of the total electricity bill. But for the poorest people, who are more likely to be at home all day, the savings could be larger. They tend to use fewer lights but to have them for longer. If we wanted to more precisely focus the scheme, it could be restricted to the same groups as the ECO is targeting – older people and households in the most deprived areas.

Even though the scale of this proposal is quite small, it would induce a much faster shift to LEDs than will otherwise occur. It can be targeted at people for whom cash is tight and therefore for whom a switch to LEDs is simply too expensive, even though the payback is only a few years.

The push to improve the energy efficiency of UK homes must go on. The last few weeks have shown how difficult it is to get insulations standards improved at a reasonable price. A switch to LEDs offers equivalent benefits and much, much easier implementation.