Biomass gasification: a new contender for decentralised power production
If you are running an electricity utility you have to worry about a lot these days. One background concern is the unfortunate tendency for small-scale electricity generation to become increasingly competitive with big power plants. Yes, for each unit of electricity produced solar panels on roofs are more expensive than PV on 20 hectare fields. However the difference isn’t overwhelming. Smaller scale versions of renewable electricity plants are cropping up all the time and each one reduces the need for big power stations.
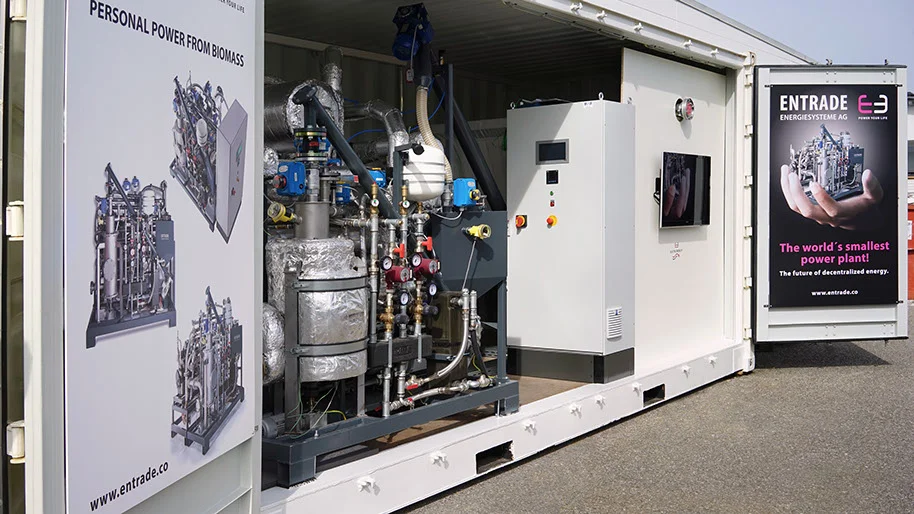
For example, NGB has a very interesting compact anaerobic digestion (AD) system that means an individual farmer can justify generating electricity from farm waste. And now the Germans have arrived with a plausible small scale wood gasifier that may make it possible to generate electricity from pellets at a cost that competes with Drax’s huge biomass burners. If it works as advertised, this containerised combined heat and power plant will change the economics of using wood for generating electricity. Even more importantly, it will enable decentralised power production in countries without reliable grids.
Packed into a standard shipping container, Entrade’s E3 combined heat and power plant generates 22 kilowatts of electricity and 55 kilowatts of heat. It uses half a tonne of conventional low moisture wood pellets a day in an automated systems that is said to require very little maintenance or operator intervention of any form. The delivery lorry draws up, blows the pellets into a store and the electricity gets made.
The E3 heats (very dry) pellets to a very high temperature in the absence of air. The pellets break down into what is called ‘syngas’, an energy-rich mixture of mainly hydrogen and carbon monoxide. This gas is fed into an engine that burns it and turns a turbine, generating electricity.
Attempts to gasify wood to make electricty at small scale in the past have failed, usually because the plant has used relatively high moisture chips. Nasty tars clog the engine. Pellets are much dryer, usually with less than 10% moisture, and produce very little tar. Reports from the initial UK customer suggest that the E3 may be the first smaller gasifier to work reliably.
Does it make sense financially? At today’s subsidy levels, the answer is firmly yes, particularly if the user is off the gas grid and would otherwise have to use oil or LPG for heating. Medium-sized rural businesses with high heat needs are going to find this gasifier extremely attractive. I spoke to UK distributors, Tompkinson Heating in Cheshire and they suggested an installed price of between £130,000 and £150,000.
Revenues from operating the E3
The unit is eligible for subsidies for electricity and heat generation.
Electricity. Electricity produced from the combustion of syngas qualifies 2 ROCs for every MWh generated. If the E3 operates 8,000 hours a year and generates 22 kW, it will produce revenue of about £15,000 at current ROC prices.
If the business uses the electricity and replaces purchased power at 10p a kWh, the value is a further £18,000. Added these two sources of revenue together and the value of electricity produced will be around £33,000.
Heat. If the heat is used for an eligible purpose, such as drying wood, heating a greenhouse or running a hotel, then it qualifies for the commercial Renewable Heat incentive (RHI). This pays 7.6p for every kilowatt hour produced. 55 kW for 8,000 hours a year. The money from this will be about £33,000.
The value of the heat produced will depend partly on whether the E3 replaces mains gas as a source of heat or whether the business uses oil or LPG for heating. Mains gas for a smallish commercial user might be priced at around 2.5p per kilowatt hour. An efficient boiler might typically convert this at 85% efficiency meaning the underlying cost of the mains gas that would need to be bought to provide 55 kW will be around £13,000. (LPG would be at least twice this).
So, in summary, the stream of financial benefits from an E3 that successfully works 8,000 hours a year (about 92% up-time) will be as follows.

Of course the E3 gasifier needs wood as a fuel. Tompkinson Heating says it consumes 20-21 kg of wood pellets an hour. Let’s be conservative and say 23 kg. For operation of 8,000 hours a year, at a cost of £210 per delivered tonne, the operator will pay about £39,000. I use £210 a tonne for pellets because that is the price Tompkinson itself pays, but I think that larger buyers will be able to pay less. The market price for pellets at a UK port is about £105 a tonne today.
If the E3 is widely installed in the UK in off-grid wooded areas, such as in parts of Wales and Scotland, it may make sense eventually to develop a commercial pellet mill specifically for users in these areas. Before that, the correct choice may be to locate these little plants near to UK pellet mills, minimising transport costs for the fuel.
Before maintenance and labour costs, the operating profit before maintenance and parts charges is around £40,000 for a customer on the gas grid. This might be about £53,000 for someone not on mains gas. The company quotes a figure of £5,100 for the annual costs of monitoring the machine remotely from Germany and for the oil and filter changes. The engine, made by GM, is guaranteed for 30,000 hours and the company claims a life for whole machine of perhaps 30 years. After allocating some labour costs to the machine, the E3 seems likely to pay back in four or five years, if the heat is fully used.
This is a new product in a field which has seen several past failures. So one shouldn’t be too optimistic. But if it works, it is going to be profitable in the UK and push more 24 hour generation to the edge of the grid. The value to countries with no grid is potentially enormous, particularly if the price falls as the manufacturer drives out production costs.